Free Access
Fig. 2.
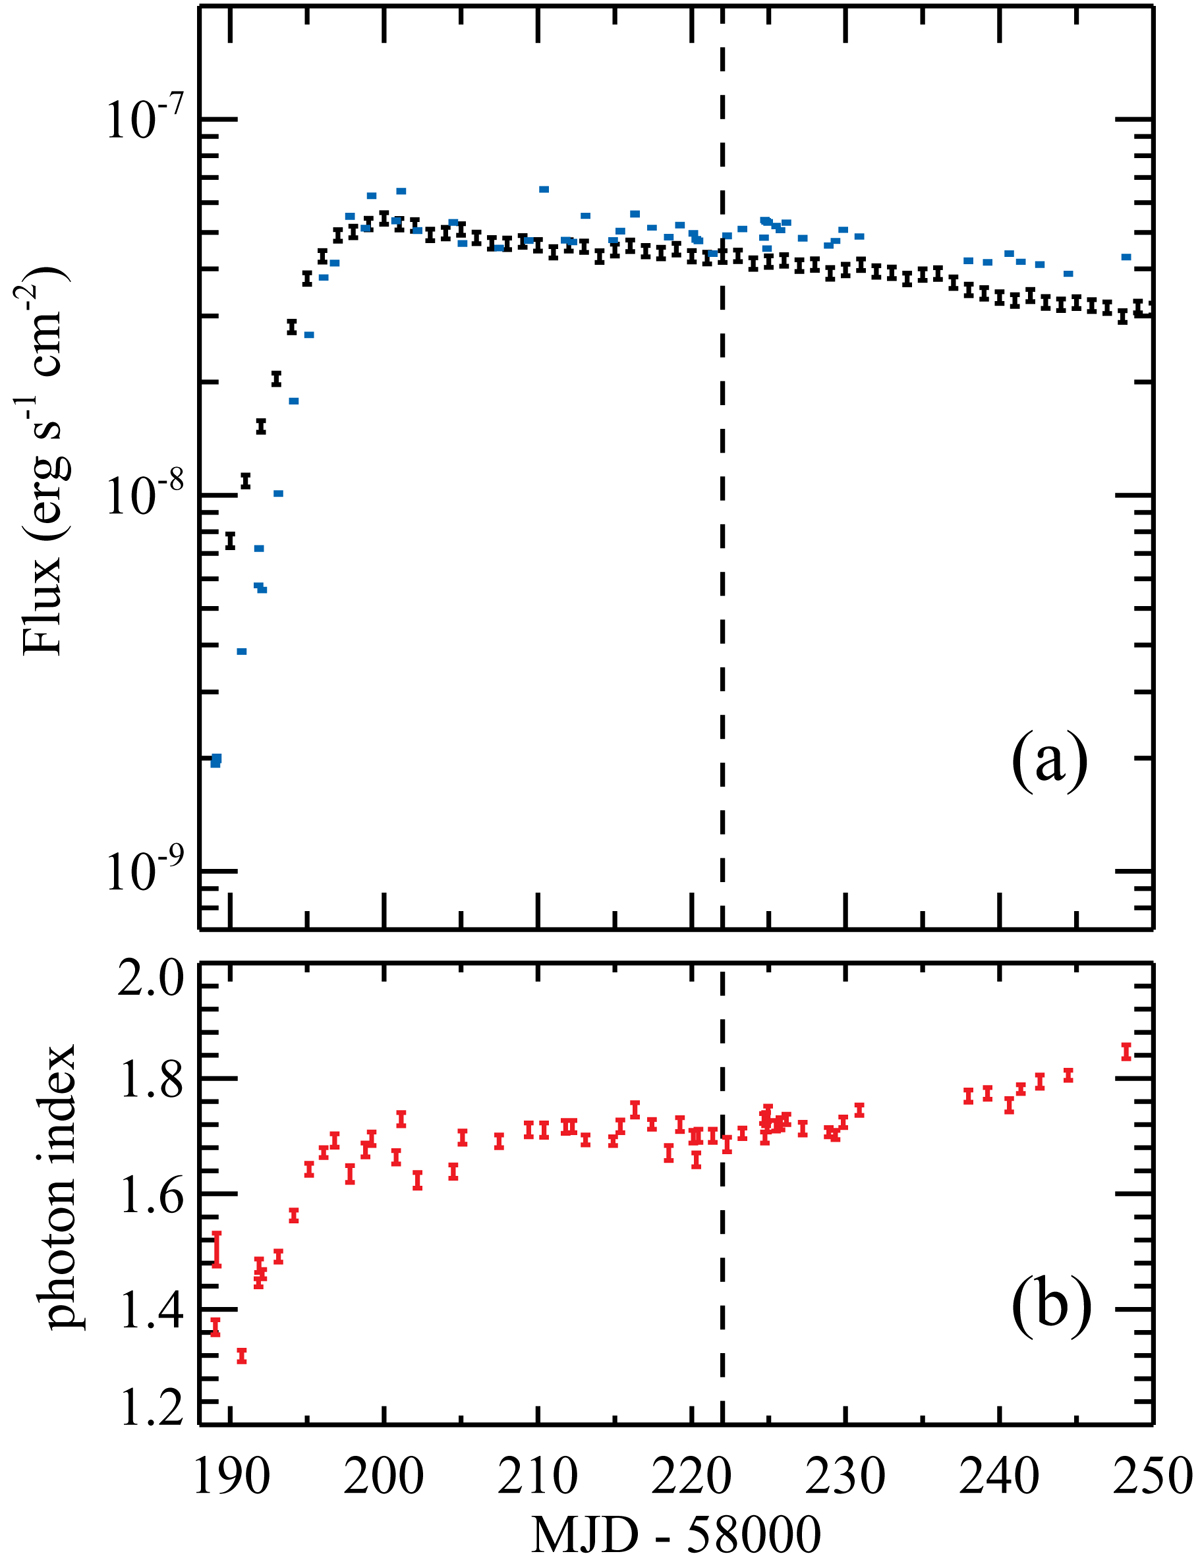
Panel a: MAXI J1820+070 outburst light curves at the initial stages as determined by the Swift/BAT (black error bars) and the Swift/XRT (blue error bars) in the 15–50 keV and 0.5–10 keV bands. Panel b: evolution of the photon index as seen by the Swift/XRT. The vertical line marks MJD 58222.
Current usage metrics show cumulative count of Article Views (full-text article views including HTML views, PDF and ePub downloads, according to the available data) and Abstracts Views on Vision4Press platform.
Data correspond to usage on the plateform after 2015. The current usage metrics is available 48-96 hours after online publication and is updated daily on week days.
Initial download of the metrics may take a while.