Fig. 9
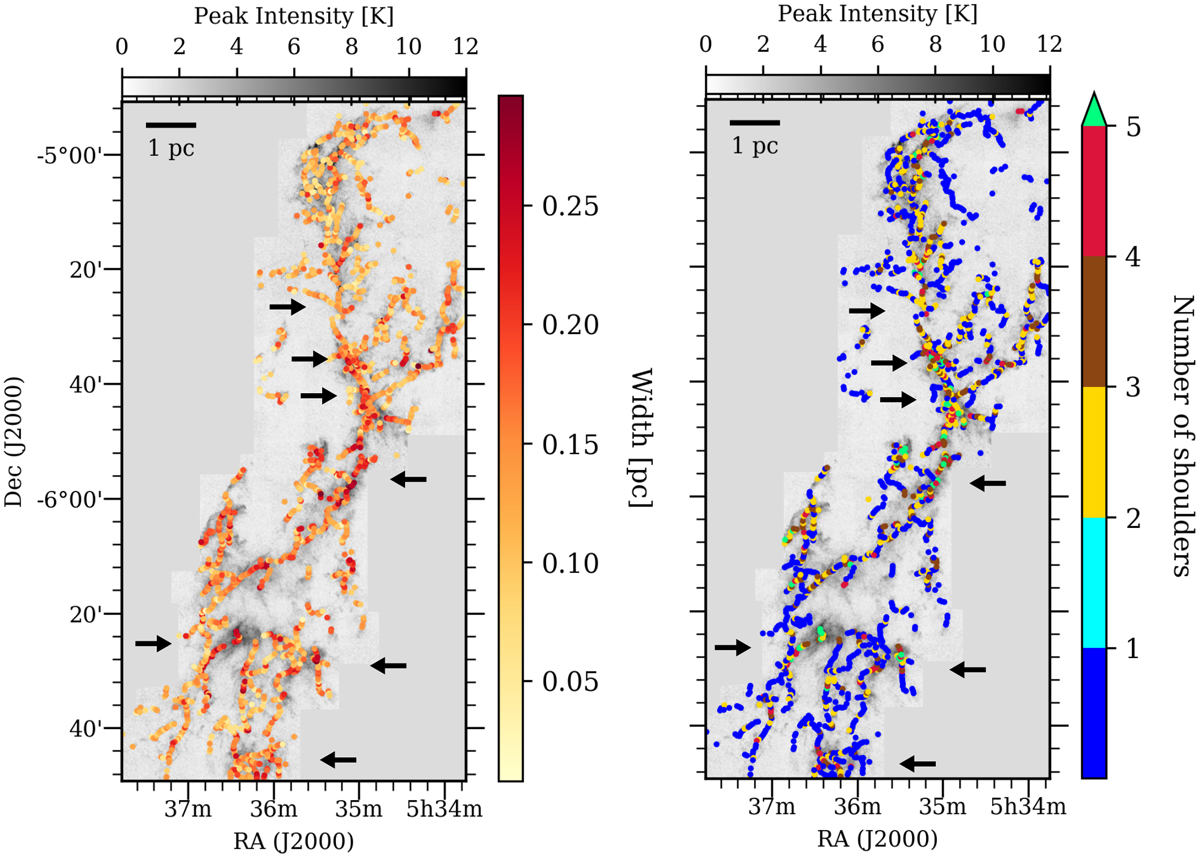
Filament width (left panel) and number of shoulders (right panel) for the filaments identified in Orion A overlayed on the C18 O peak intensity map. The color of each point along filaments represents the width (left panel) and the number of shoulders (right panel) at that point, corresponding to the colorbar shown in the right side of the panels. The arrows indicate the positions of hubs at which the filaments converge.
Current usage metrics show cumulative count of Article Views (full-text article views including HTML views, PDF and ePub downloads, according to the available data) and Abstracts Views on Vision4Press platform.
Data correspond to usage on the plateform after 2015. The current usage metrics is available 48-96 hours after online publication and is updated daily on week days.
Initial download of the metrics may take a while.