Fig. 8
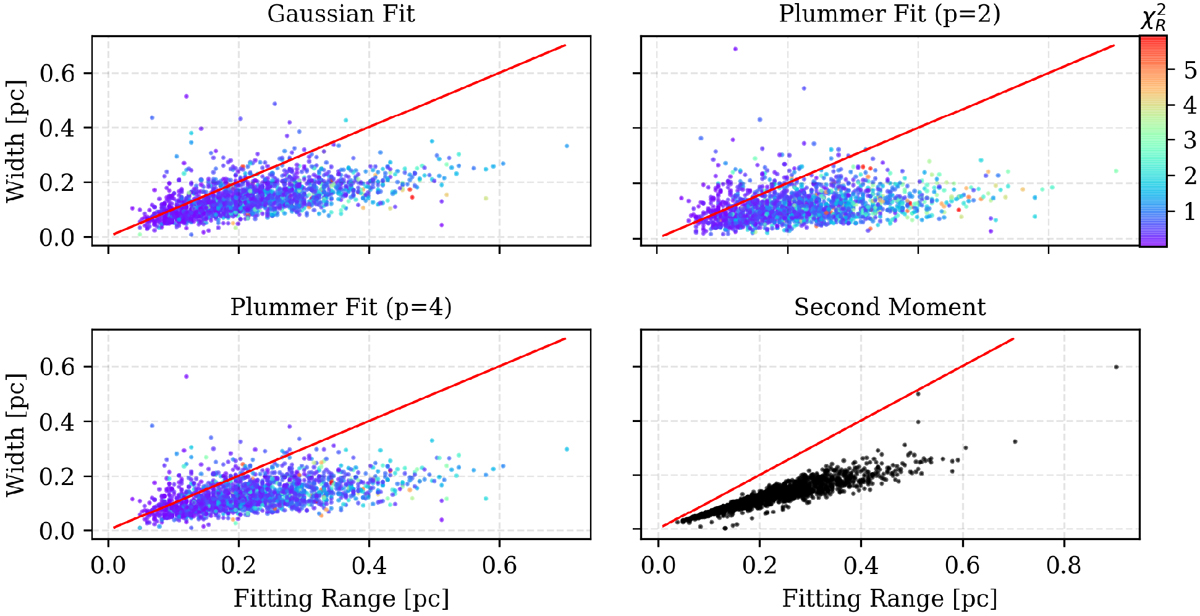
Correlation between the calculated filament widths and the fitting range on the radial intensity profile over which the width is calculated. The red diagonal line shows the 1:1 correlation between the two parameters. The strongest correlation is observed when instead of the fits, the second moment of the distribution is used. The color bar indicates the reduced chi-squared values for the fits. There is also a slight correlation between the reduced chi-squared and the fitting range.
Current usage metrics show cumulative count of Article Views (full-text article views including HTML views, PDF and ePub downloads, according to the available data) and Abstracts Views on Vision4Press platform.
Data correspond to usage on the plateform after 2015. The current usage metrics is available 48-96 hours after online publication and is updated daily on week days.
Initial download of the metrics may take a while.