Fig. 6
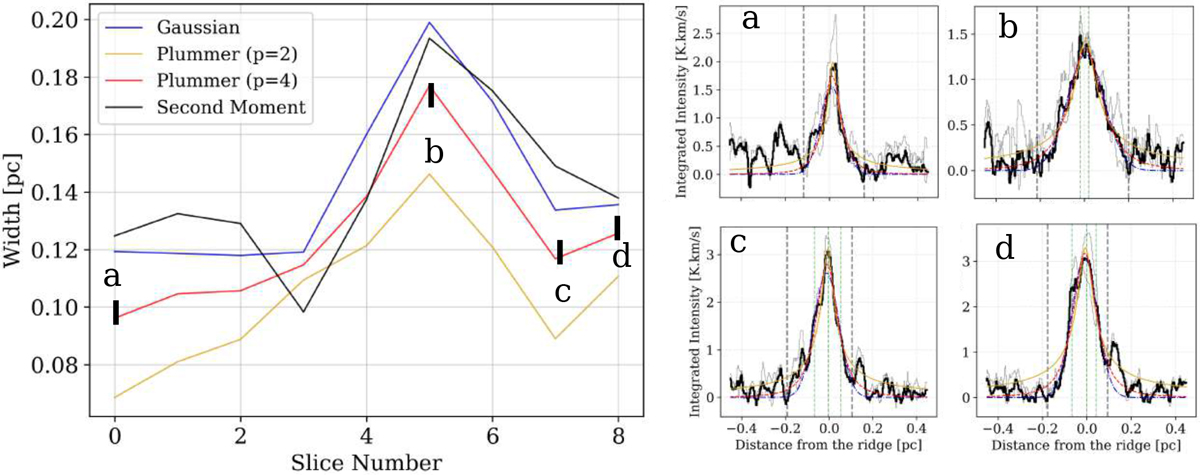
Left panel: variation of filament width along the length of a single filament taken as an example. The slice numbers correspond to different positions along the filament. Each slice shown here represents the averaged value over two consecutive perpendicular cuts. These slices are always separated by 1.5 beamsizes (0.0225 pc) and the length of the filament is 0.4 pc. Right panel: selected intensity profiles at points “a”, “b”, “c”, and “d” show in the left panel. These points are selected to best represent the variation of the width along the filament. Vertical gray dashed lines indicate the boundaries of the fits while the green dashed lines indicate the shoulders of the profiles.
Current usage metrics show cumulative count of Article Views (full-text article views including HTML views, PDF and ePub downloads, according to the available data) and Abstracts Views on Vision4Press platform.
Data correspond to usage on the plateform after 2015. The current usage metrics is available 48-96 hours after online publication and is updated daily on week days.
Initial download of the metrics may take a while.