Fig. 5
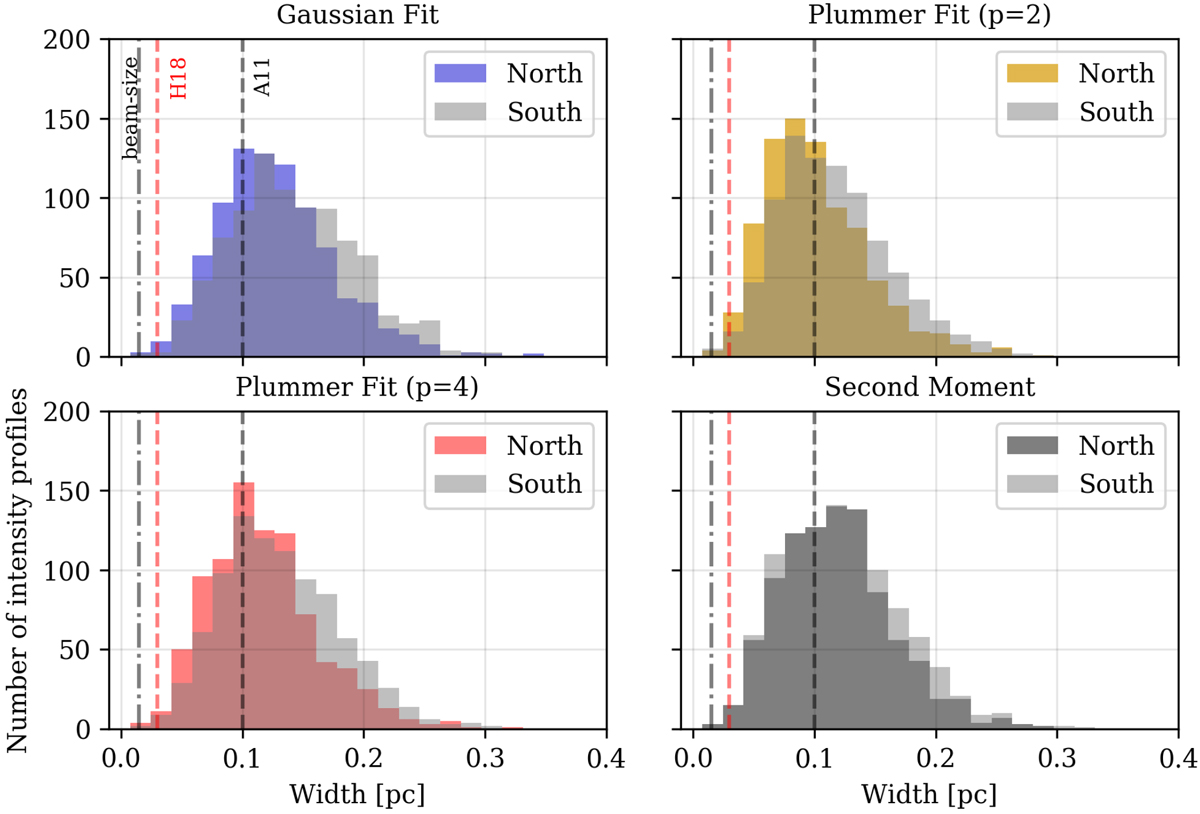
Distribution of filament widths in the norther (colored) and southern (gray) regions of Orion A (see Fig. 2) calculated using Gaussian fits (top left panel), the second moment of distribution (bottom right panel), and Plummer-like fits with power law indices p = 2 (top right panel) and p = 4 (bottom left panel). The vertical dashed lines represent the filament widths from Hacar et al. (2018) in red, and the “characteristic” filament width (Arzoumanian et al. 2011) in black. The dot-dashed line indicates the beam-size of our observations.
Current usage metrics show cumulative count of Article Views (full-text article views including HTML views, PDF and ePub downloads, according to the available data) and Abstracts Views on Vision4Press platform.
Data correspond to usage on the plateform after 2015. The current usage metrics is available 48-96 hours after online publication and is updated daily on week days.
Initial download of the metrics may take a while.