Fig. 3
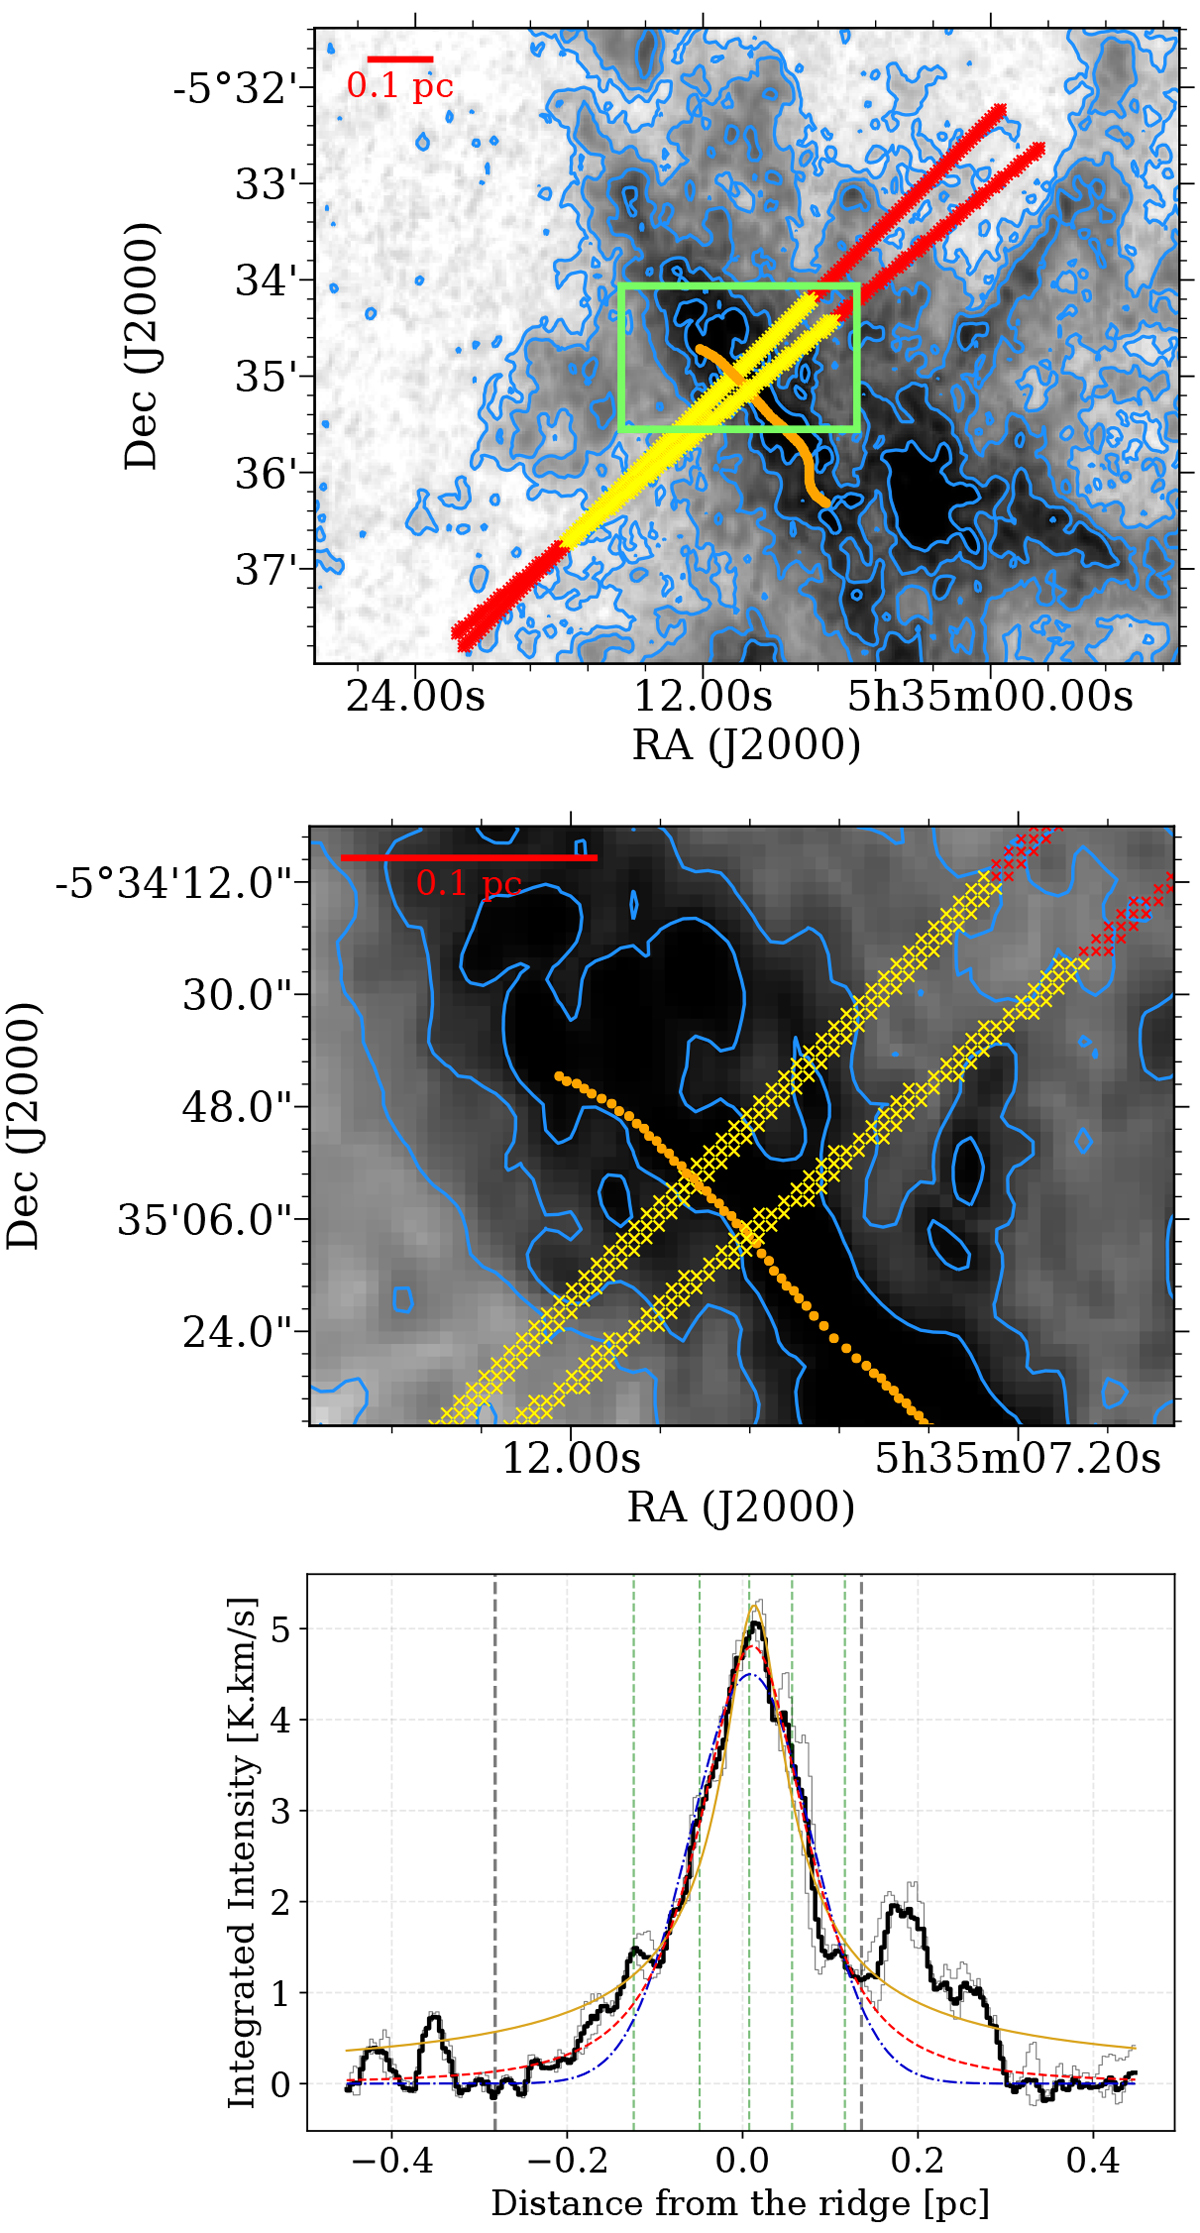
Top panel: C18O peak intensity emission overlaid with a filament spine (in orange) and 2 perpendicular slices (in red and yellow). The yellow portion of the slices indicate the extent of emission fitted with FilChaP. The green box indicates the magnified region shown in the middle panel. Contours indicate emission levels of 2, 3, 5, 7, 9, 11 K. Middle panel: expanded view of the perpendicular slices. The perpendicular pixels used to extract the intensities at each radial bin are marked with crosses. Bottom panel: intensity profiles (gray lines) extracted from the slices overlaid on the map in the middle panel. Blue, yellow, and red curves fitted to the averaged intensity profile (black) indicate Gaussian and Plummer-like fits with p = 2 and 4, respectively. The vertical gray dashed lines show the positions of the identified minima considered during the fitting procedure (see Sect. 3.1). Vertical green dashed lines correspond to shoulders as explained in Sect. 4.1.
Current usage metrics show cumulative count of Article Views (full-text article views including HTML views, PDF and ePub downloads, according to the available data) and Abstracts Views on Vision4Press platform.
Data correspond to usage on the plateform after 2015. The current usage metrics is available 48-96 hours after online publication and is updated daily on week days.
Initial download of the metrics may take a while.