Fig. A.3
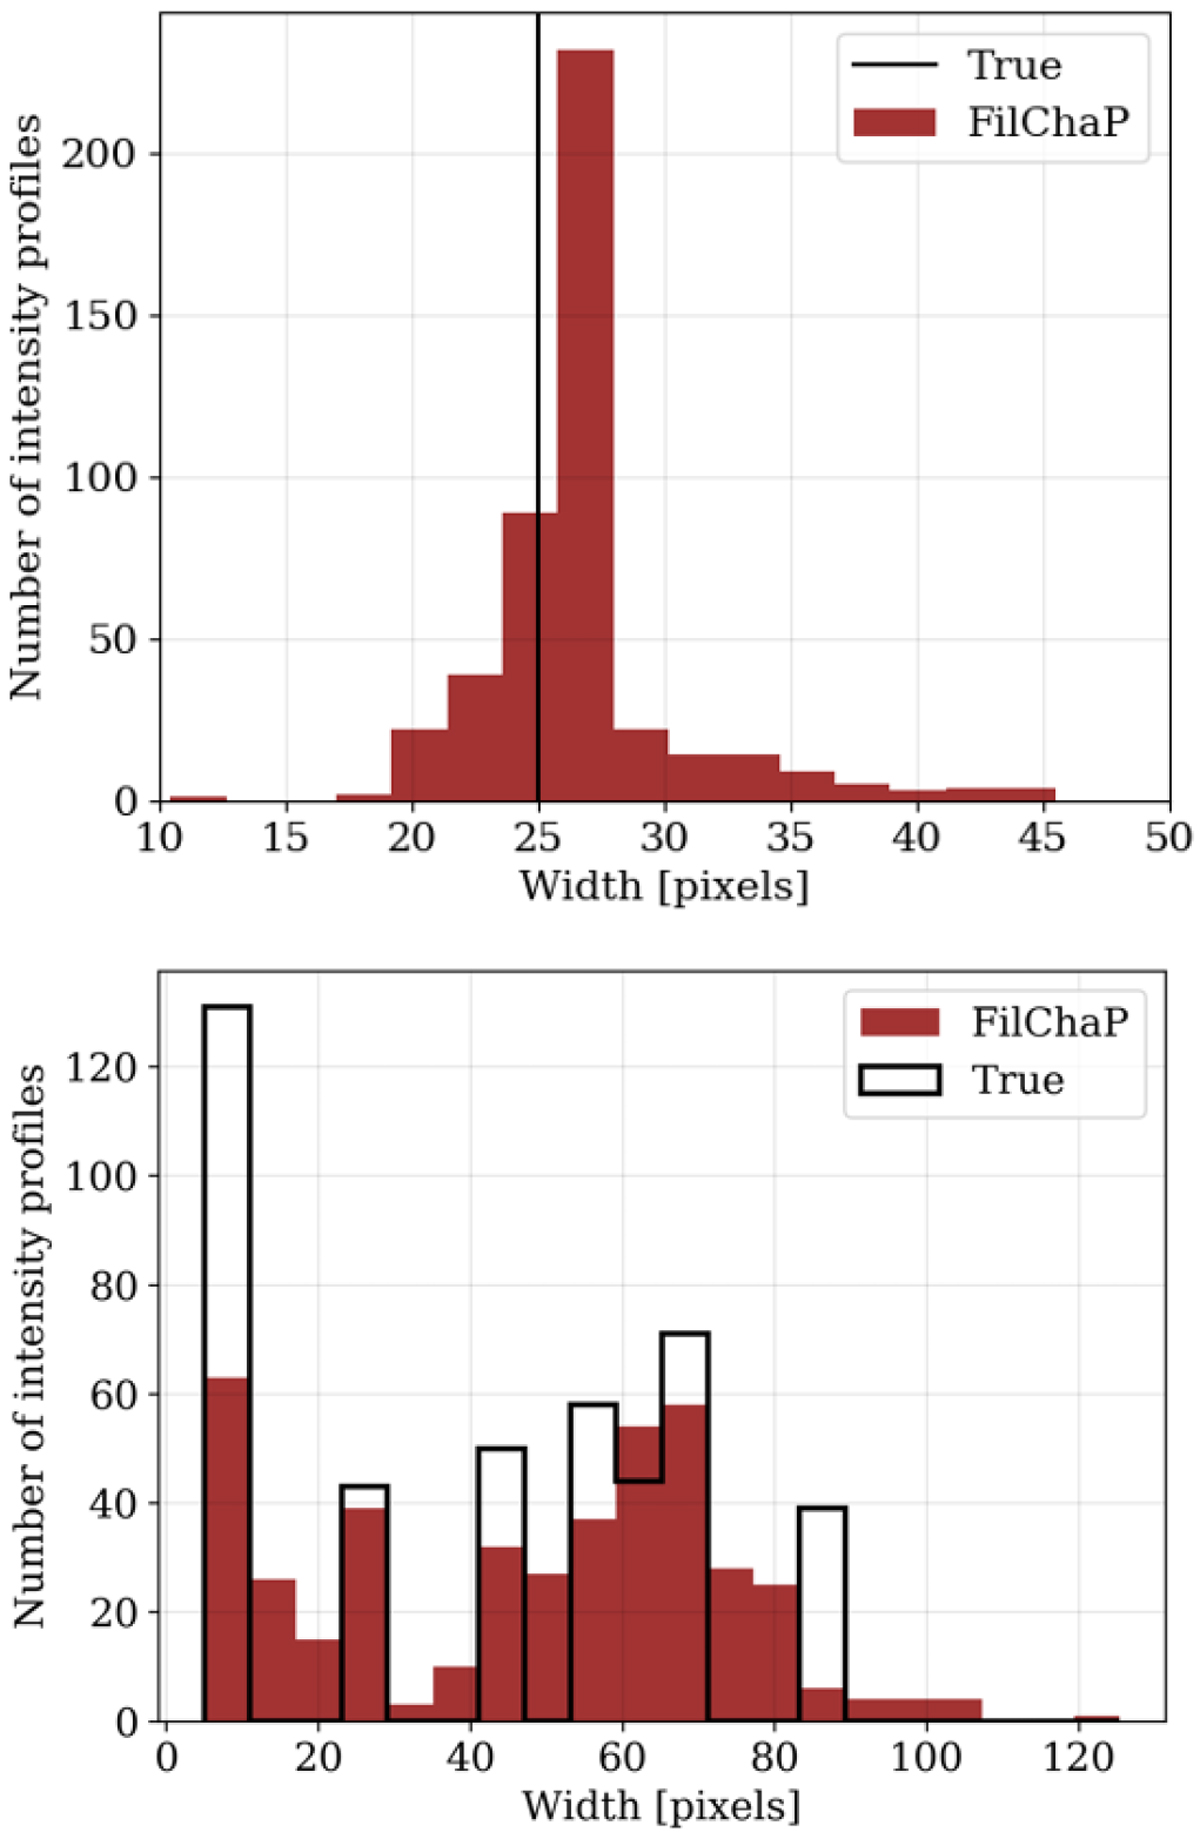
Distribution of filament widths for the test two cases presented in Fig. A.2. For Case 1 (top panel) the input widths of all the filaments are 25 pixels (solid black line) and the mean of the width distribution calculated with FilChap is 26.5 ± 4.2 pixels. For Case 2 (bottom panel), the true distribution of the input filament widths is given with the black histogram, and the width calculation that results using FilChap is given with the red histogram. The Spearman correlation coefficient between the two datasets is 0.77.
Current usage metrics show cumulative count of Article Views (full-text article views including HTML views, PDF and ePub downloads, according to the available data) and Abstracts Views on Vision4Press platform.
Data correspond to usage on the plateform after 2015. The current usage metrics is available 48-96 hours after online publication and is updated daily on week days.
Initial download of the metrics may take a while.