Fig. A.1
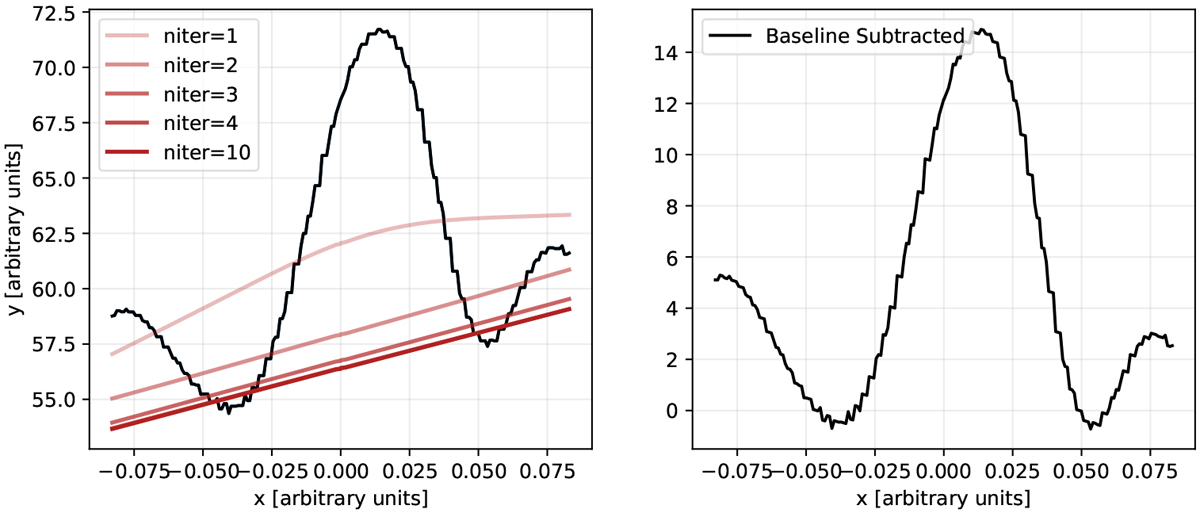
Example baseline subtraction process. Left panel: data with a baseline gradient is shown with the black solid curve. The curves with different shades of red represent the AsLS baselines calculated with different number of iterations. The solutions for the baseline converge rather quickly within ten iterations. Right panel: baseline subtracted profile.
Current usage metrics show cumulative count of Article Views (full-text article views including HTML views, PDF and ePub downloads, according to the available data) and Abstracts Views on Vision4Press platform.
Data correspond to usage on the plateform after 2015. The current usage metrics is available 48-96 hours after online publication and is updated daily on week days.
Initial download of the metrics may take a while.