Fig. 11
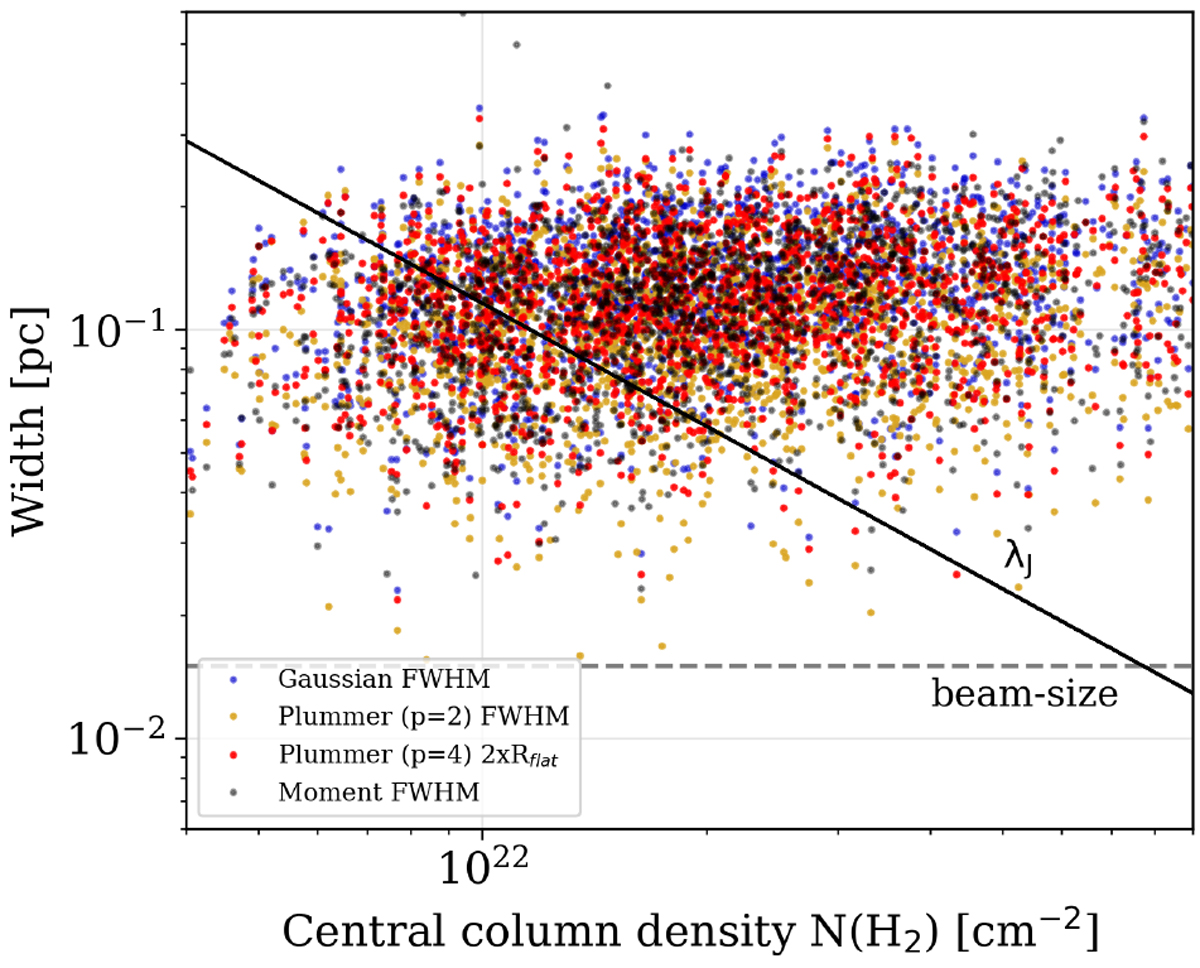
Filament widths calculated using the four different methods plotted against the central column density at each point where the width is calculated. The colors represent FWHM of Gaussian fits (blue), moment analysis (black), Plummer p = 2 (yellow) and p = 4 (red). The dashed line represents the resolution of our observations and the solid diagonal line the thermal Jeans length at 10 K.
Current usage metrics show cumulative count of Article Views (full-text article views including HTML views, PDF and ePub downloads, according to the available data) and Abstracts Views on Vision4Press platform.
Data correspond to usage on the plateform after 2015. The current usage metrics is available 48-96 hours after online publication and is updated daily on week days.
Initial download of the metrics may take a while.