Free Access
Fig. 10
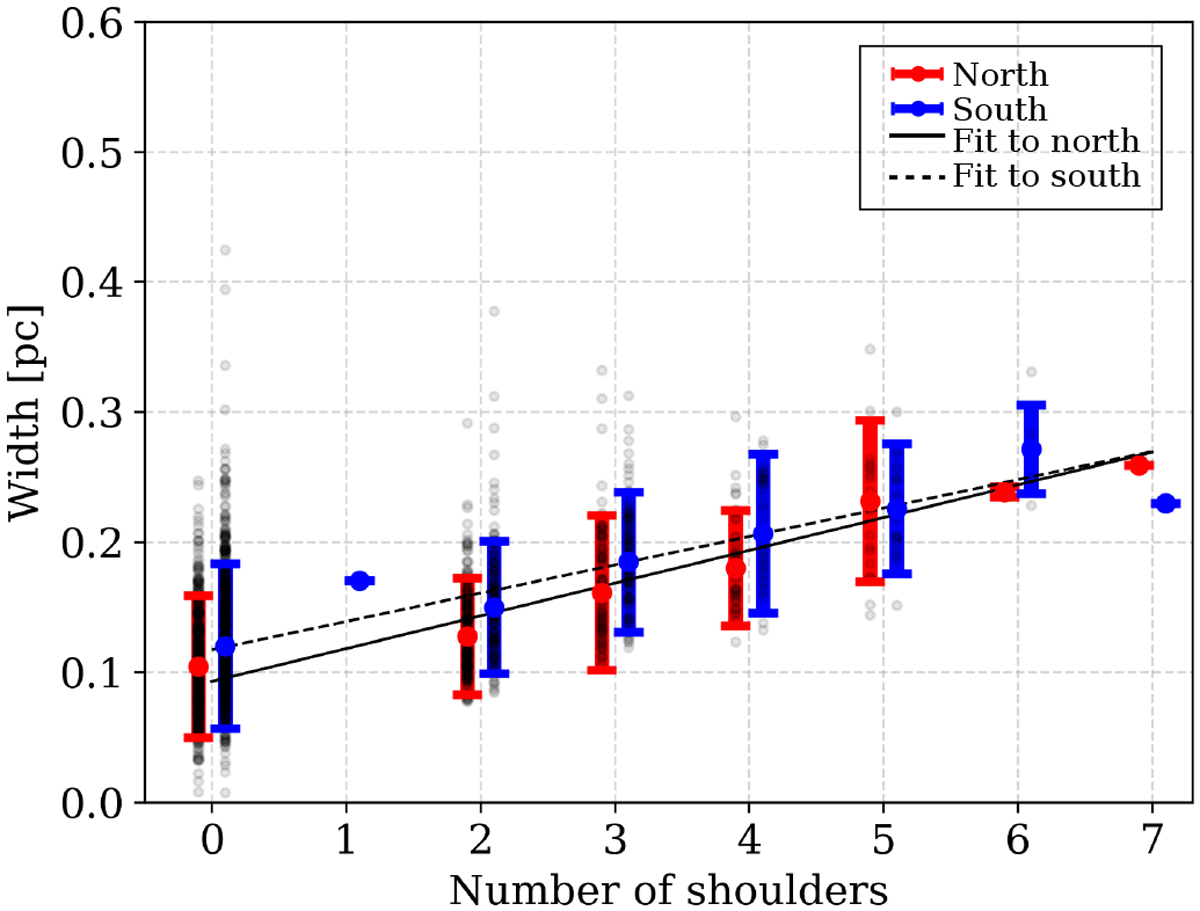
Variation of the filament width with respect to detected number of shoulders in the corresponding intensity profile. The gray circles represent the data points, the red and blue filled circles are the median values. The shown error bars on the median values represent the interquartile range.
Current usage metrics show cumulative count of Article Views (full-text article views including HTML views, PDF and ePub downloads, according to the available data) and Abstracts Views on Vision4Press platform.
Data correspond to usage on the plateform after 2015. The current usage metrics is available 48-96 hours after online publication and is updated daily on week days.
Initial download of the metrics may take a while.