Fig. 1
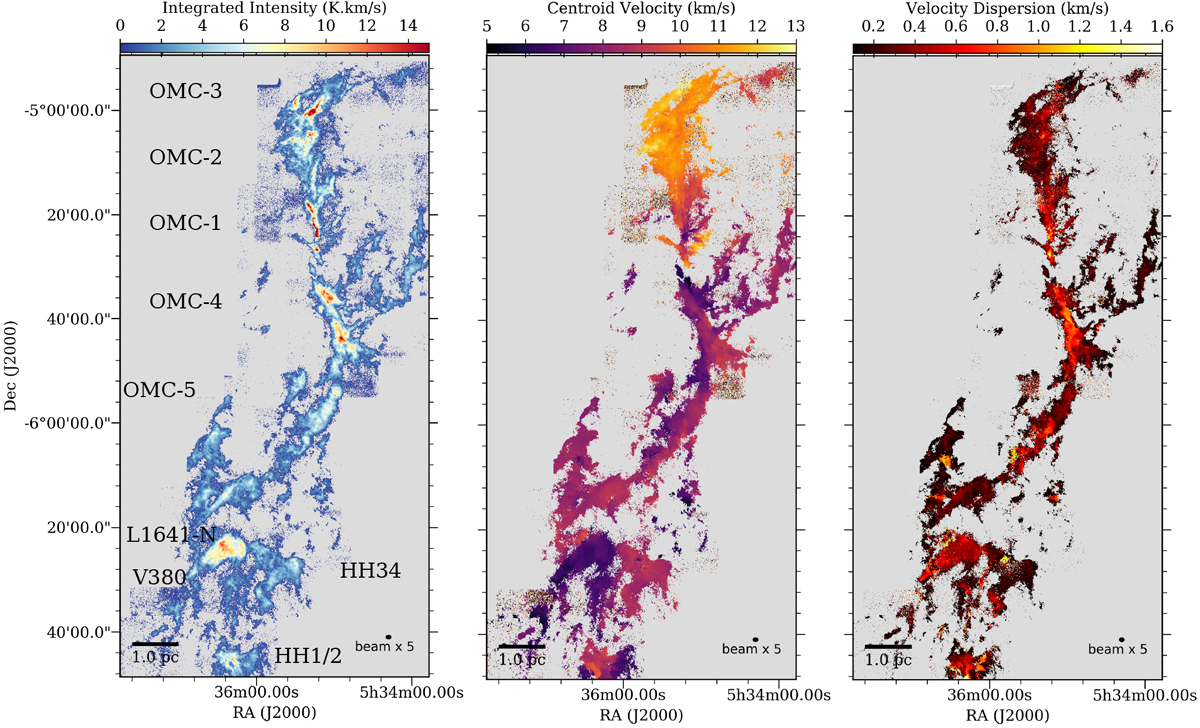
Moment maps of C18O J = 1–0. From left to right panels: integrated intensity emission, the centroid velocity, and the velocity dispersion. Relevant star-forming regions are marked on the integrated intensity map. Beam-size shown in the bottom left corner is five times the real beam size (5 × 0.015 pc) ofthe observations for demonstration purposes.
Current usage metrics show cumulative count of Article Views (full-text article views including HTML views, PDF and ePub downloads, according to the available data) and Abstracts Views on Vision4Press platform.
Data correspond to usage on the plateform after 2015. The current usage metrics is available 48-96 hours after online publication and is updated daily on week days.
Initial download of the metrics may take a while.