| Issue |
A&A
Volume 623, March 2019
|
|
|---|---|---|
| Article Number | C2 | |
| Number of page(s) | 2 | |
| Section | Galactic structure, stellar clusters and populations | |
| DOI | https://doi.org/10.1051/0004-6361/201834020e | |
| Published online | 19 March 2019 | |
Open cluster kinematics with Gaia DR2⋆ (Corrigendum)
1
Laboratoire d’Astrophysique de Bordeaux, Univ. Bordeaux, CNRS, B18N, allée Geoffroy Saint-Hilaire, 33615 Pessac, France
e-mail: caroline.soubiran@u-bordeaux.fr
2
Institut de Ciències del Cosmos, Universitat de Barcelona (IEEC-UB), Martí i Franquès 1, 08028 Barcelona, Spain
3
INAF-Osservatorio Astronomico di Padova, vicolo Osservatorio 5, 35122 Padova, Italy
4
INAF-Osservatorio di Astrofisica e Scienza dello Spazio, via Gobetti 93/3, 40129 Bologna, Italy
5
CENTRA, Faculdade de Ciências, Universidade de Lisboa, Ed. C8, Campo Grande, 1749-016 Lisboa, Portugal
6
Department of Physics and Astronomy, Uppsala University, Box 516, 75120 Uppsala, Sweden
7
GEPI, Observatoire de Paris, Université PSL, CNRS, 5 Place Jules Janssen, 92190 Meudon, France
Key words: stars: kinematics and dynamics / Galaxy: kinematics and dynamics / open clusters and associations: general / errata, addenda
The table with clusters velocities is only available at the CDS via anonymous ftp to cdsarc.u-strasbg.fr (130.79.128.5) or via http://cdsarc.u-strasbg.fr/viz-bin/qcat?J/A+A/623/C2
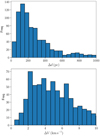
Due to an unfortunate error in the computation of distance between clusters, Tables 4 and 5, and Fig. 12 in Sect. 3.3 of the original paper contain incorrect values. Here we present the updated tables and figure.
Table 4 gives the list of cluster pairs that differ by less than 100 pc in distance and 5 km s−1 in velocity in our high-quality sample. The closest pair includes ASCC 16 and ASCC 21, which are separated by ∼13 pc, with a velocity difference of 4.5 km s−1. RSG 7 and RSG 8, as well as ASCC 16 and ASCC 19, are also close pairs separated by ∼24 pc, with velocity differences of 2.3 km s−1 and 3.6 km s−1 respectively, thus good candidates to be physically related. Several possibly larger complexes may be found in that table, formed by clusters that appear more than one time. Table 5 gives a list of candidates binaries from the literature. The most famous binary cluster formed by h and χ Persei (NGC 869 and NGC 884, Messow & Schorr 1913) appears to have a separation of 19.5 pc. An excellent candidate binary is the pair Collinder 394 and NGC 6716, which lie at a distance of ∼11 pc from each other. IC 2602 and Platais 8 are also close from each other (∼35 pc) and they are possibly physically related, owing to their common age in DAML and similar velocity (also reported in Table 4). The other pairs in Table 5 have much larger separation and they are more likely to result from a chance alignment than that they are a physical binary system.
Pairs of OCs differing by less than 100 pc in their Galactic position and 5 km s−1 in velocity in the high-quality sample.
Separation in space and velocity of binary candidates from the literature, computed from our mean parameters for 861 OCs.
 |
Fig. 12. Histogram of the distance between nearest neighbours in the high-quality sample (upper panel) and the same in velocity (lower panel). |
References
- Casamiquela, L., Carrera, R., Jordi, C., et al. 2016, MNRAS, 458, 3150 [NASA ADS] [CrossRef] [Google Scholar]
- Conrad, C., Scholz, R.-D., Kharchenko, N. V., et al. 2017, A&A, 600, A106 [NASA ADS] [CrossRef] [EDP Sciences] [Google Scholar]
- De Silva, G. M., Carraro, G., D’Orazi, V., et al. 2015, MNRAS, 453, 106 [NASA ADS] [CrossRef] [Google Scholar]
- Messow, B., & Schorr, R. R. E.1913, Astronomische Abhandlungen der Hamburger Sternwarte, 2, 1 [Google Scholar]
© C. Soubiran et al. 2019
 Open Access article, published by EDP Sciences, under the terms of the Creative Commons Attribution License (http://creativecommons.org/licenses/by/4.0), which permits unrestricted use, distribution, and reproduction in any medium, provided the original work is properly cited.
All Tables
Pairs of OCs differing by less than 100 pc in their Galactic position and 5 km s−1 in velocity in the high-quality sample.
Separation in space and velocity of binary candidates from the literature, computed from our mean parameters for 861 OCs.
All Figures
 |
Fig. 12. Histogram of the distance between nearest neighbours in the high-quality sample (upper panel) and the same in velocity (lower panel). |
| In the text | |
Current usage metrics show cumulative count of Article Views (full-text article views including HTML views, PDF and ePub downloads, according to the available data) and Abstracts Views on Vision4Press platform.
Data correspond to usage on the plateform after 2015. The current usage metrics is available 48-96 hours after online publication and is updated daily on week days.
Initial download of the metrics may take a while.


