Fig. 6.
Download original image
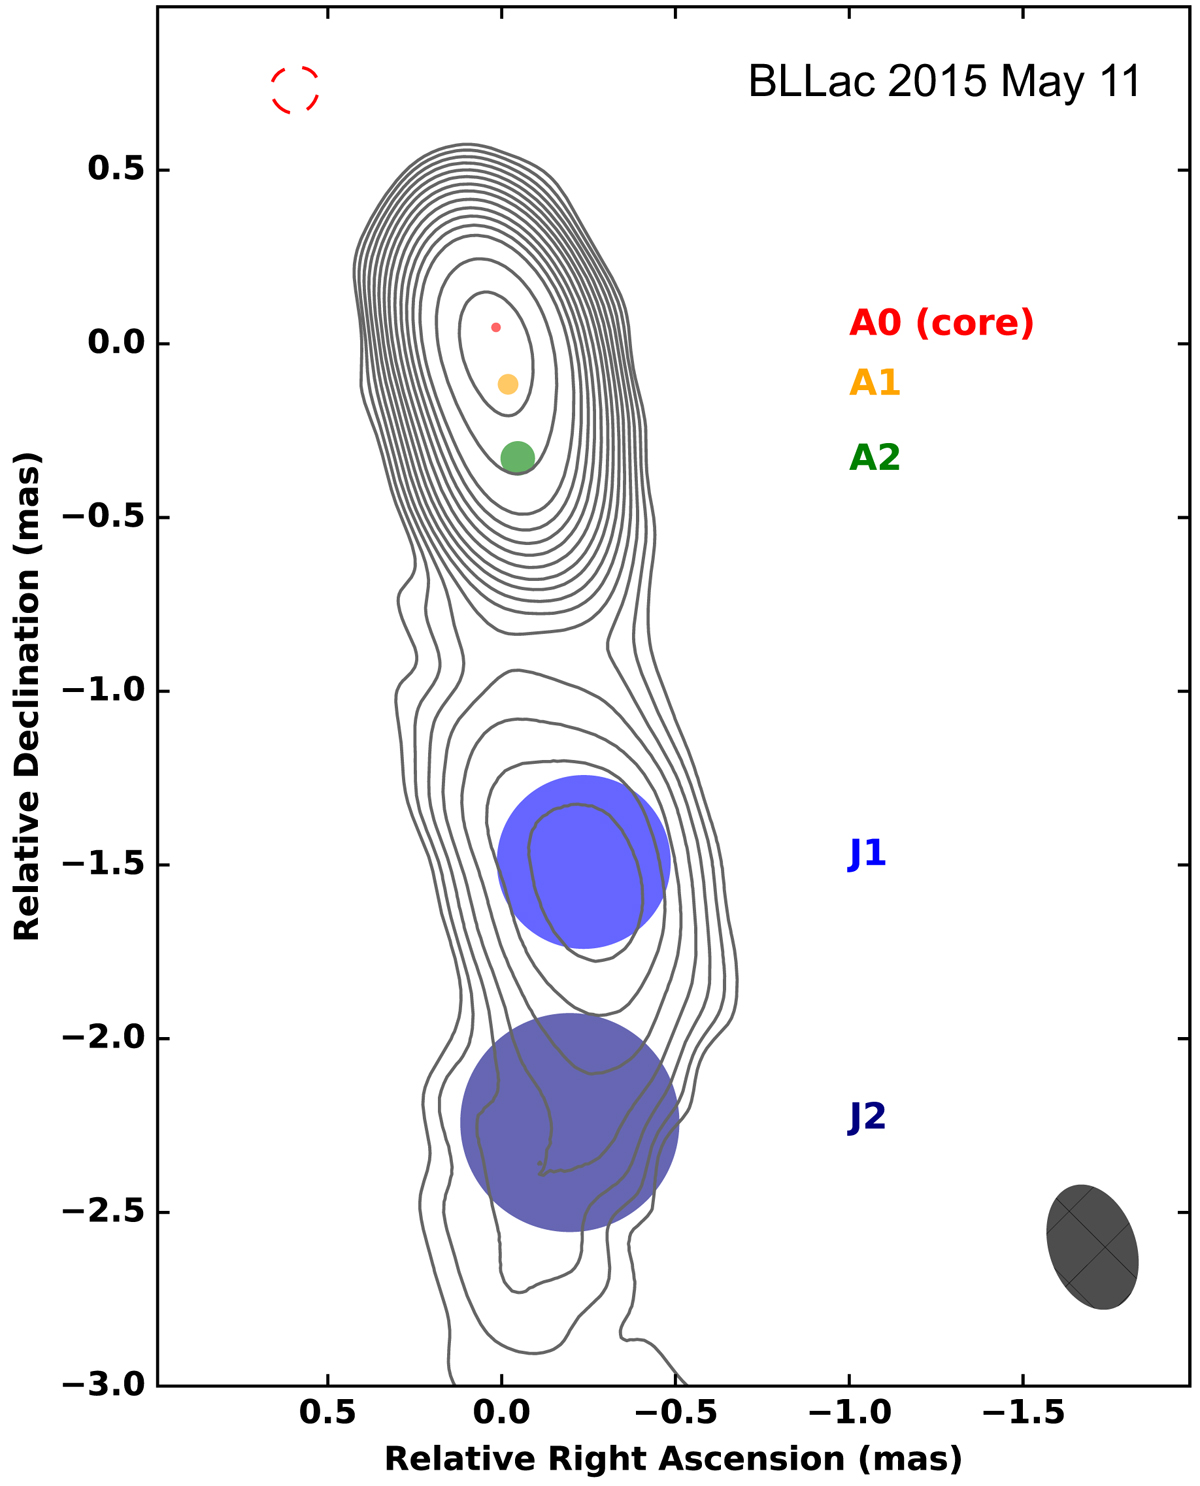
A 43 GHz VLBA image of BL Lac on 2015 May 11. Contours start from −1, 1, 2 (and so on) times 1.7 mJy beam−1 and increase by factors of ![]() (negative contours are coloured in red). The beam size is shown at the bottom-right corner of the plot and is 0.325 mas by 0.208 mas at PA 20.6°. The peak flux density of the map is 1.88 Jy beam−1. The image also superposes a set of best-fitted circular Gaussian components – A0(=core), A1, A2, J1 and J2. A0, A1 and A2 are well-known stationary features located at the core, ∼0.14 mas and ∼0.3 mas away, respectively (see e.g. Wehrle et al. 2016).
(negative contours are coloured in red). The beam size is shown at the bottom-right corner of the plot and is 0.325 mas by 0.208 mas at PA 20.6°. The peak flux density of the map is 1.88 Jy beam−1. The image also superposes a set of best-fitted circular Gaussian components – A0(=core), A1, A2, J1 and J2. A0, A1 and A2 are well-known stationary features located at the core, ∼0.14 mas and ∼0.3 mas away, respectively (see e.g. Wehrle et al. 2016).
Current usage metrics show cumulative count of Article Views (full-text article views including HTML views, PDF and ePub downloads, according to the available data) and Abstracts Views on Vision4Press platform.
Data correspond to usage on the plateform after 2015. The current usage metrics is available 48-96 hours after online publication and is updated daily on week days.
Initial download of the metrics may take a while.