Free Access
Fig. 3.
Download original image
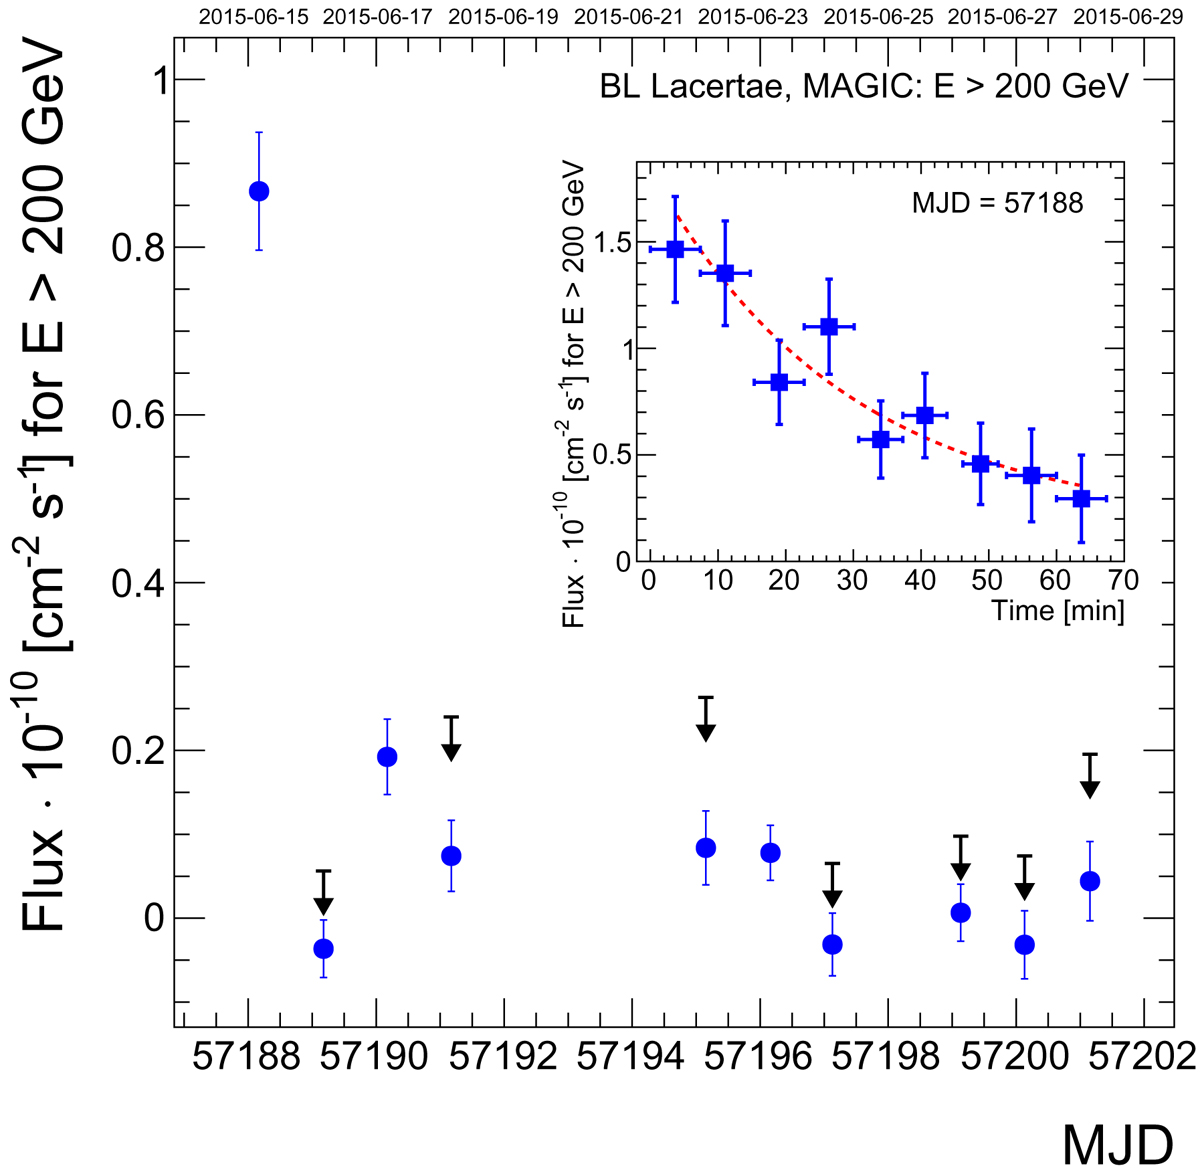
Daily light curve of the VHE γ-ray emission from BL Lac above 200 GeV between 2015 June 15 and 28. The time evolution of the flare on MJD 57188 is shown in the inset. Arrows on this figure show the 95% confidence level upper limits.
Current usage metrics show cumulative count of Article Views (full-text article views including HTML views, PDF and ePub downloads, according to the available data) and Abstracts Views on Vision4Press platform.
Data correspond to usage on the plateform after 2015. The current usage metrics is available 48-96 hours after online publication and is updated daily on week days.
Initial download of the metrics may take a while.