Fig. 1.
Download original image
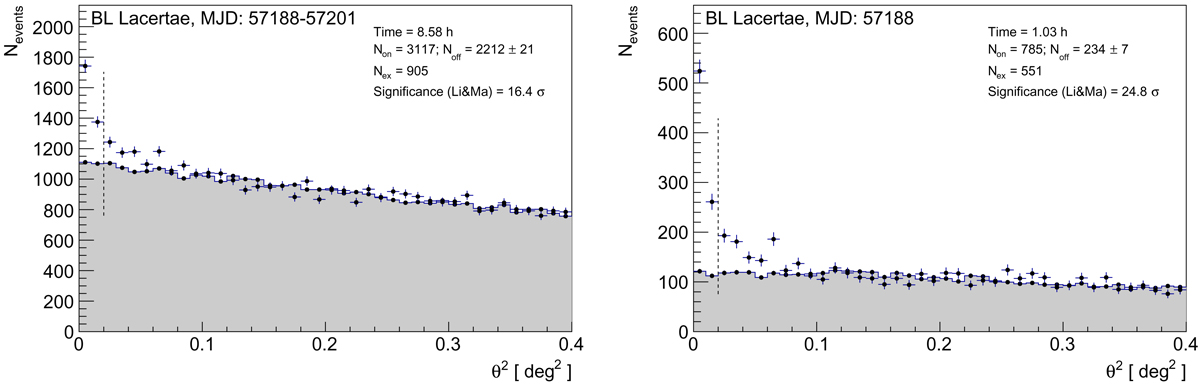
Theta-squared distribution of data taken between 2015 June 15 and 28 (left) and on 2015 June 15 (right). Excess events are shown with filled circles, highlighted with blue crosses, and the normalized off-source events are shown with a grey histogram. The energy threshold is ∼70 GeV. The vertical dashed line marks the limit of the signal region at θ2 = 0.02°.
Current usage metrics show cumulative count of Article Views (full-text article views including HTML views, PDF and ePub downloads, according to the available data) and Abstracts Views on Vision4Press platform.
Data correspond to usage on the plateform after 2015. The current usage metrics is available 48-96 hours after online publication and is updated daily on week days.
Initial download of the metrics may take a while.