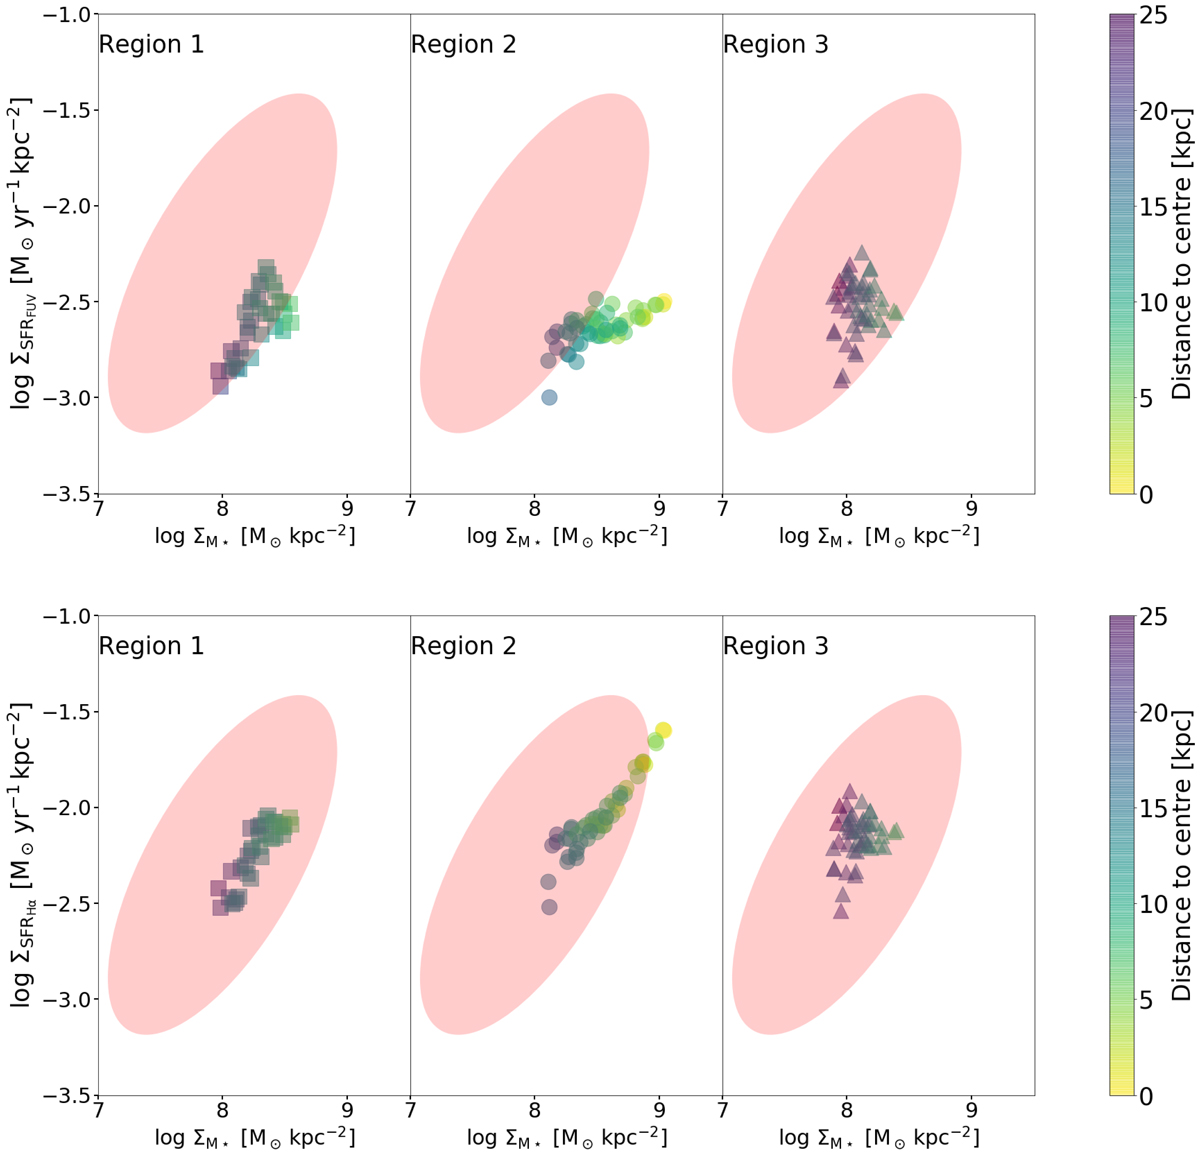
Fig. 11.
Download original image
SFR per area vs. stellar mass surface density for different regions in the disc of UGC 10214. Upper row: SFR derived from the FUV and 24 μm emissions, SFRFUV, and lower row: SFR derived from the Hα and 24 μm emission, SFRHα. The pixels in the separate panels correspond to the different regions shown in Fig. 1. The colour of the markers of the different regions indicates the distance to the galaxy centre. For comparison, the pink ellipse shows the location of the resolved MS from Ellison et al. (2018).
Current usage metrics show cumulative count of Article Views (full-text article views including HTML views, PDF and ePub downloads, according to the available data) and Abstracts Views on Vision4Press platform.
Data correspond to usage on the plateform after 2015. The current usage metrics is available 48-96 hours after online publication and is updated daily on week days.
Initial download of the metrics may take a while.