Fig. 10.
Download original image
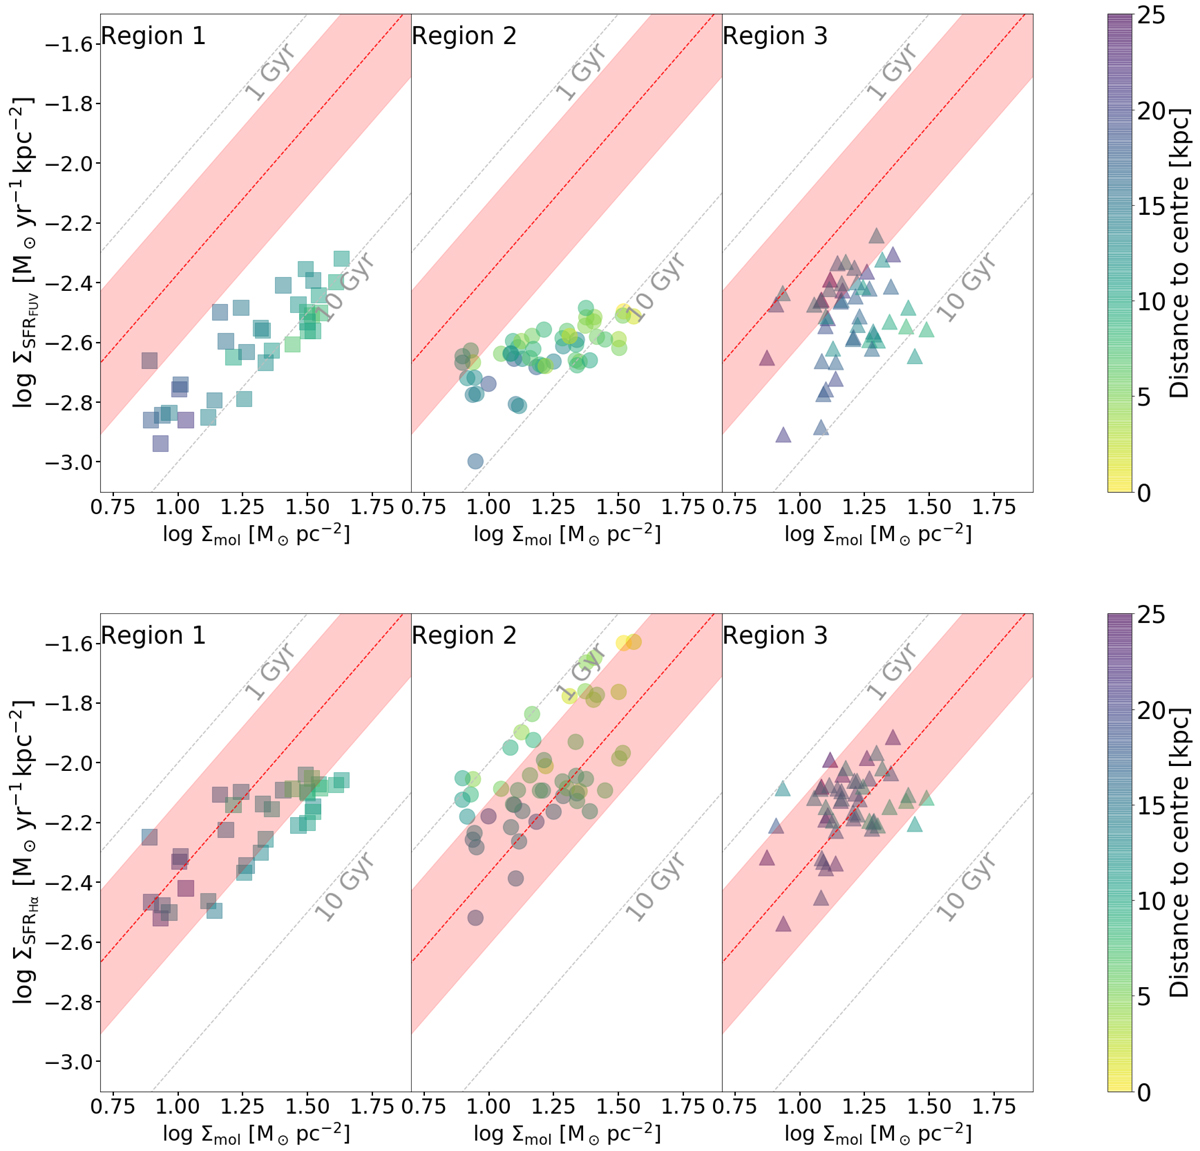
SFR per area vs. molecular gas surface density (Kennicutt-Schmidt relation) for different regions in the disc of UGC 10214. Upper row: SFR derived from FUV and 24 μm emission, SFRFUV, and lower row: SFR derived from the Hα and 24 μm emissions, SFRHα. The pixels in the separate panels correspond to the different regions shown in Fig. 1. The dashed grey lines represent different molecular gas depletion times. The dashed red line represents the depletion time estimated for star-forming galaxies (2.35 Gyr, Bigiel et al. 2011) and its dispersion (0.23 dex), represented by the pink-shaded area. The colour of the markers of the different regions indicates the distance to the galaxy centre.
Current usage metrics show cumulative count of Article Views (full-text article views including HTML views, PDF and ePub downloads, according to the available data) and Abstracts Views on Vision4Press platform.
Data correspond to usage on the plateform after 2015. The current usage metrics is available 48-96 hours after online publication and is updated daily on week days.
Initial download of the metrics may take a while.