Fig. 9.
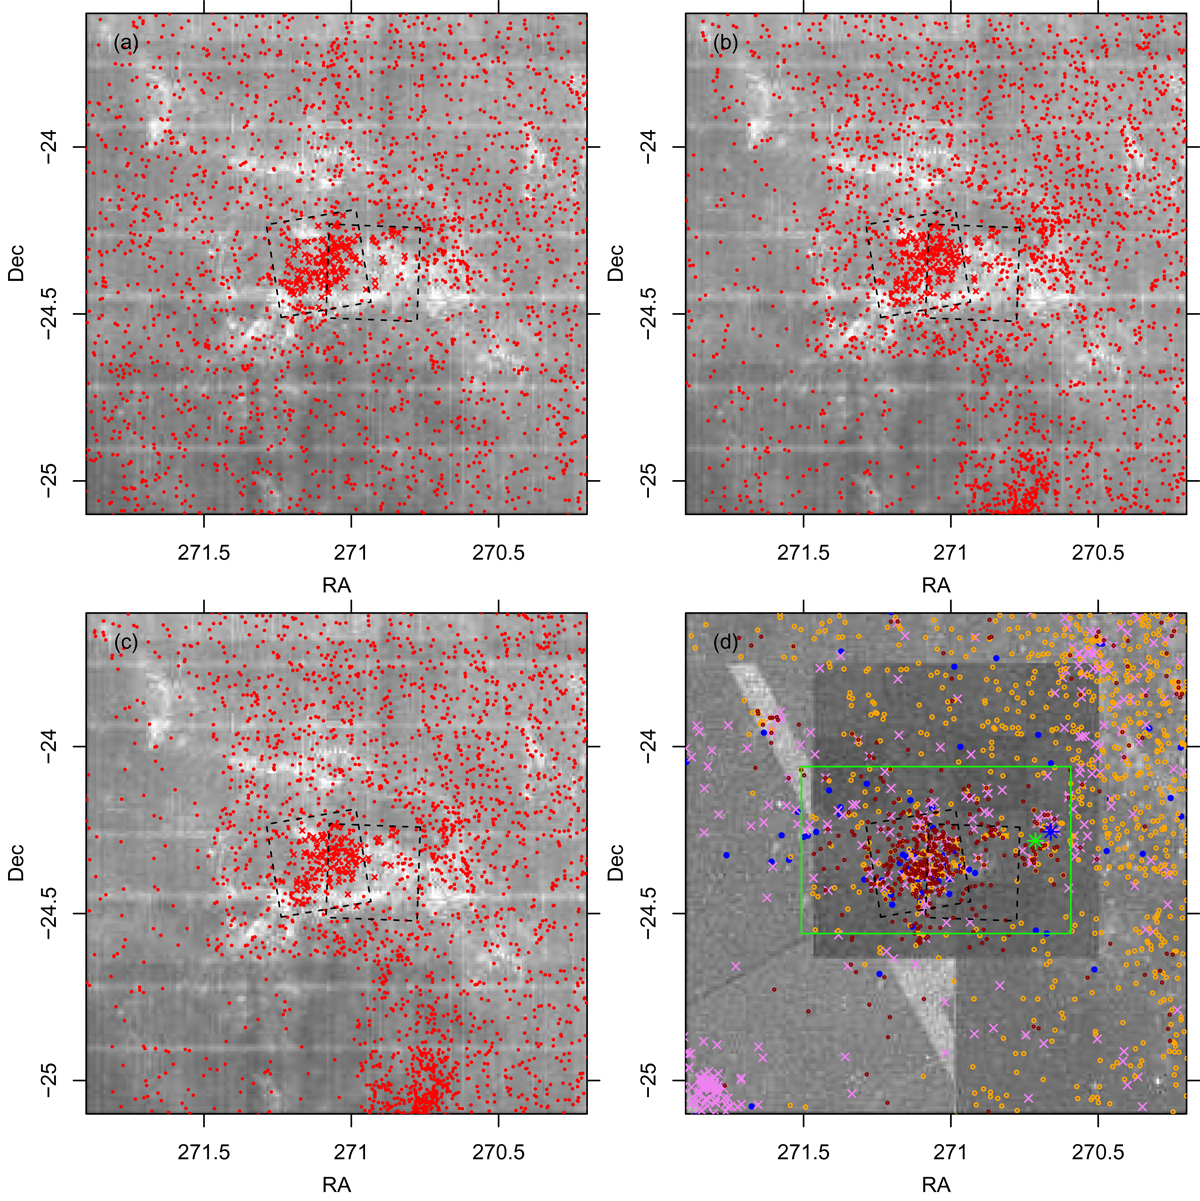
Spatial distributions of star subsamples in the studied region. The background image is a two-dimensional density histogram of stars in VPHAS+ DR2 (and sources in our NIR catalog in the bottom right panel). The dashed squares are the Chandra FOVs. Top left: Mgri stars (red) selected from Fig. 4a. Top right: MriJ stars (red) from Fig. 4b. Bottom left: MriH stars (red) from Fig. 4c. Bottom right: dark-red points, orange circles, and larger purple crosses are stars with Hα emission, optical-NIR excesses, and UV-excesses, respectively, as in Fig. 4; big blue dots are O or B stars from SIMBAD. The green rectangle is the field studied by Kalari et al. (2015). The green and blue asterisks are the stars 7 Sgr (F2II-III) and HD 164536 (O7.5V), respectively.
Current usage metrics show cumulative count of Article Views (full-text article views including HTML views, PDF and ePub downloads, according to the available data) and Abstracts Views on Vision4Press platform.
Data correspond to usage on the plateform after 2015. The current usage metrics is available 48-96 hours after online publication and is updated daily on week days.
Initial download of the metrics may take a while.