Fig. 8.
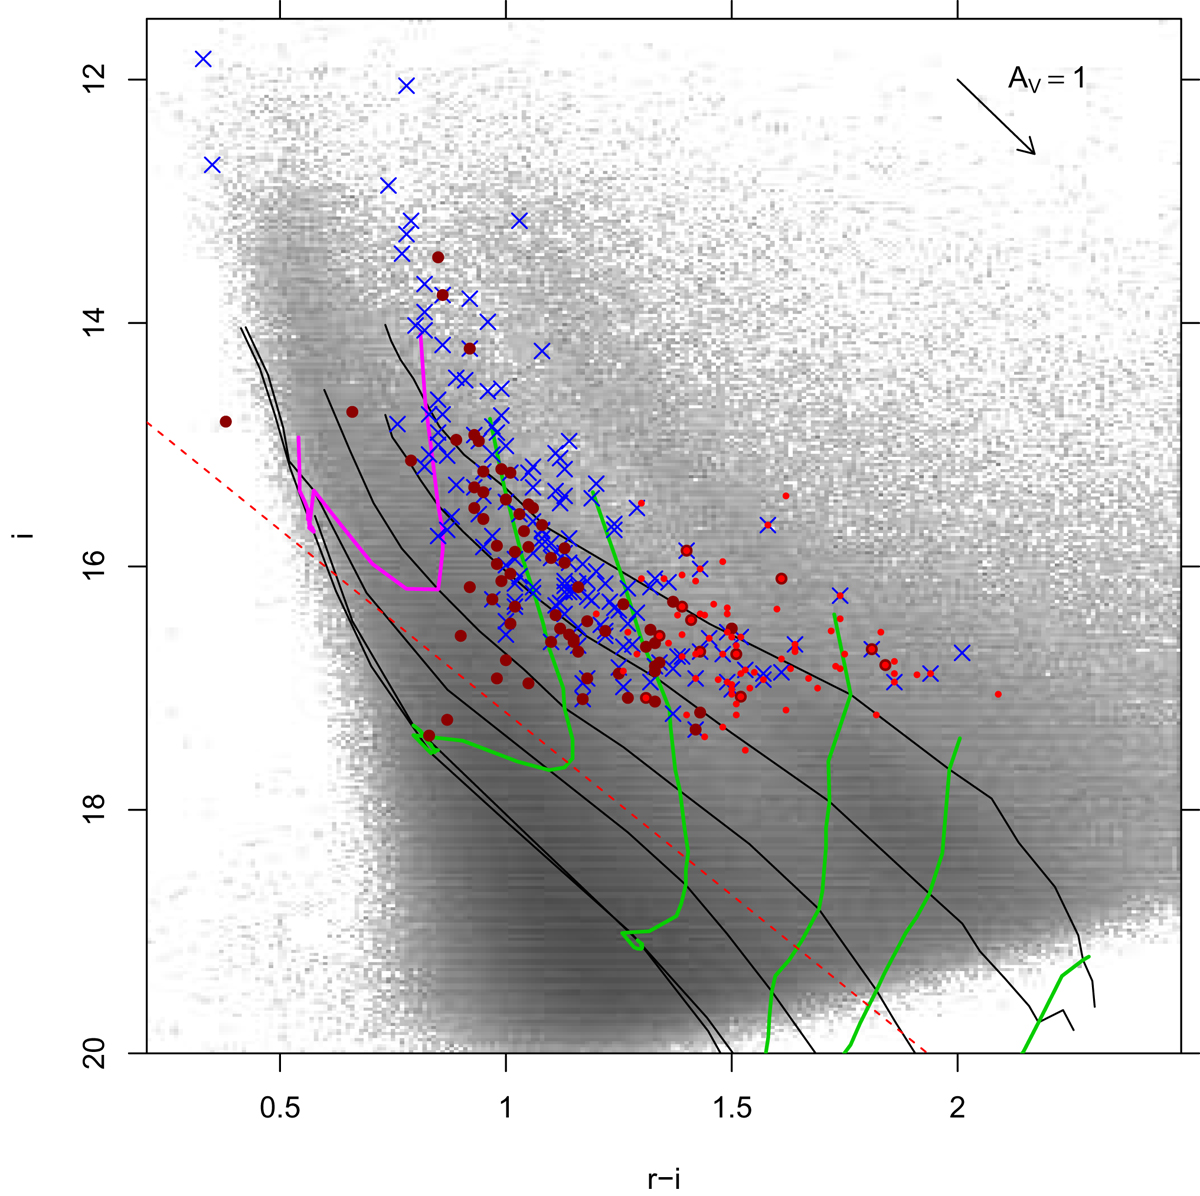
(i, r − i) color–magnitude diagram of M stars (red dots), X-ray sources (blue crosses), and CTTSs (dark-red points) which are also selected using Gaia proper motions and parallaxes. Background grayscale image: same CMD as in Fig. 5a. Evolutionary tracks, isochrones and reddening vector as in the same figure. The red dashed line (roughly corresponding to a 25 Myr isochrone) delimits the CMD region occupied by X-ray and M-type members.
Current usage metrics show cumulative count of Article Views (full-text article views including HTML views, PDF and ePub downloads, according to the available data) and Abstracts Views on Vision4Press platform.
Data correspond to usage on the plateform after 2015. The current usage metrics is available 48-96 hours after online publication and is updated daily on week days.
Initial download of the metrics may take a while.