Fig. 7.
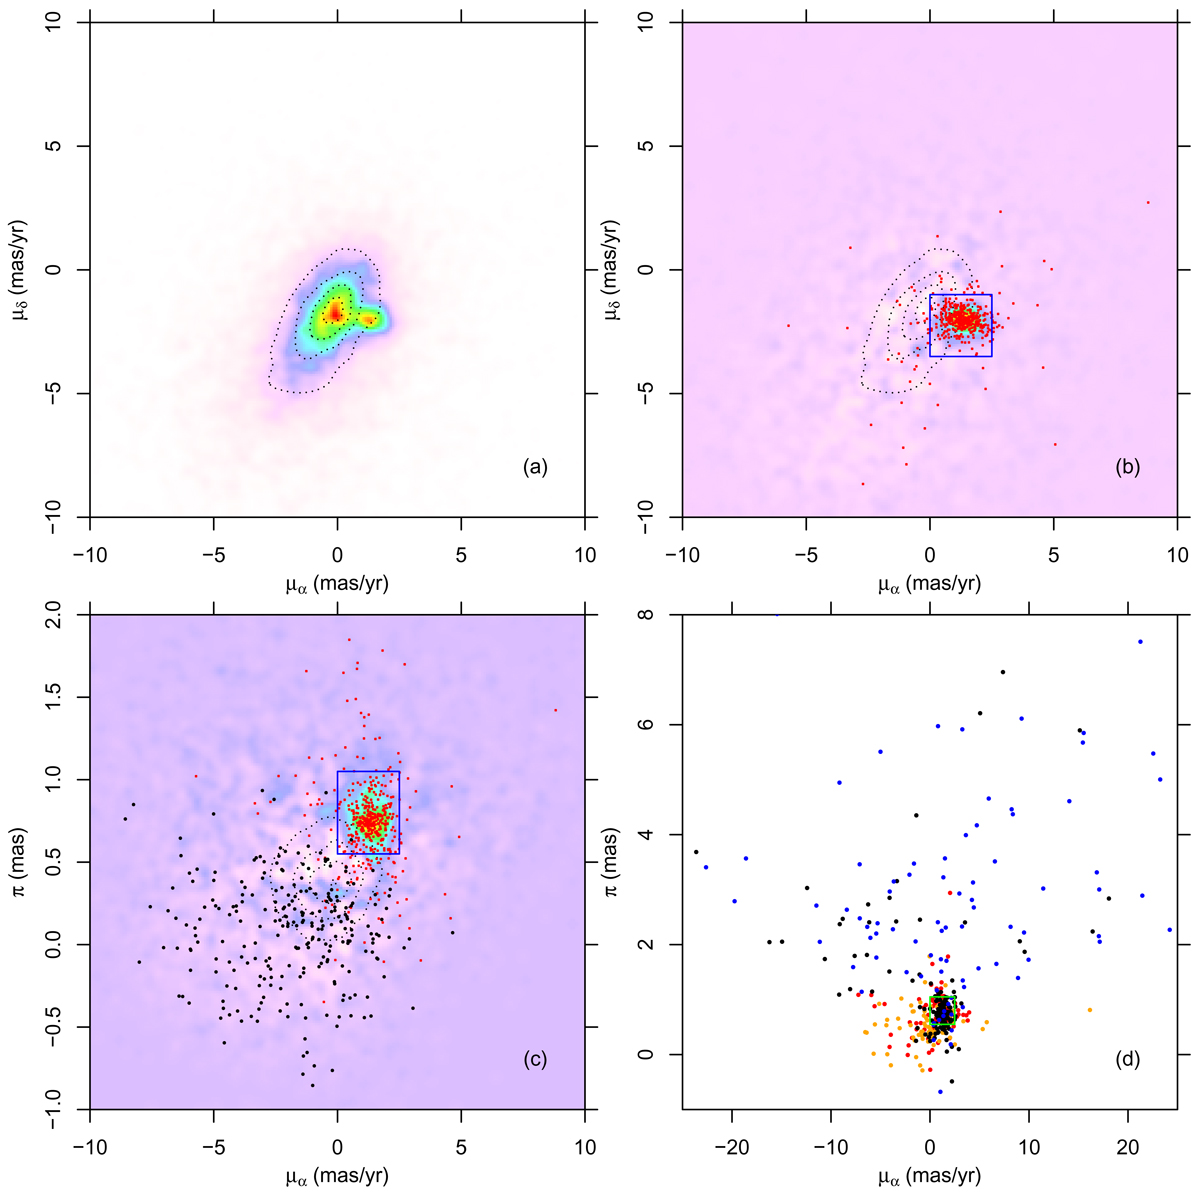
Panel a: distribution in proper-motion plane of all Gaia sources falling in the cluster region defined in Fig. 6, and having errors on μα and μδ less than 0.5 mas yr−1. The dotted contours describe instead the proper-motion distribution of Gaia sources in the reference region defined in Fig. 6, excluding those in the cluster region. Panel b: map of density difference between Gaia sources in cluster and reference regions, scaled by respective total sources numbers, in proper-motion plane. Red dots are NGC 6530 X-ray sources. The blue rectangle indicate the cluster boundaries in the proper-motion plane. Contours are the same as in panel a. Panel c: map of density difference between Gaia sources in cluster and reference regions, scaled by respective total sources numbers, in μα-parallax (π) plane. The maximum parallax error for inclusion is 0.3 mas. Red dots are NGC 6530 X-ray sources. Black dots are candidate M giants. The blue rectangle indicate the cluster boundaries in the μα-parallax plane. Contours describe the distribution of sources in the reference region. Panel d: wider-scale view of the μα − π plane of panel c. The green rectangle is the same as the blue rectangle in panel c. Black (blue) dots indicate low-reddening M stars in the cluster (reference) region, while red (orange) dots indicate CTTSs in the cluster (reference) region.
Current usage metrics show cumulative count of Article Views (full-text article views including HTML views, PDF and ePub downloads, according to the available data) and Abstracts Views on Vision4Press platform.
Data correspond to usage on the plateform after 2015. The current usage metrics is available 48-96 hours after online publication and is updated daily on week days.
Initial download of the metrics may take a while.