Fig. 6.
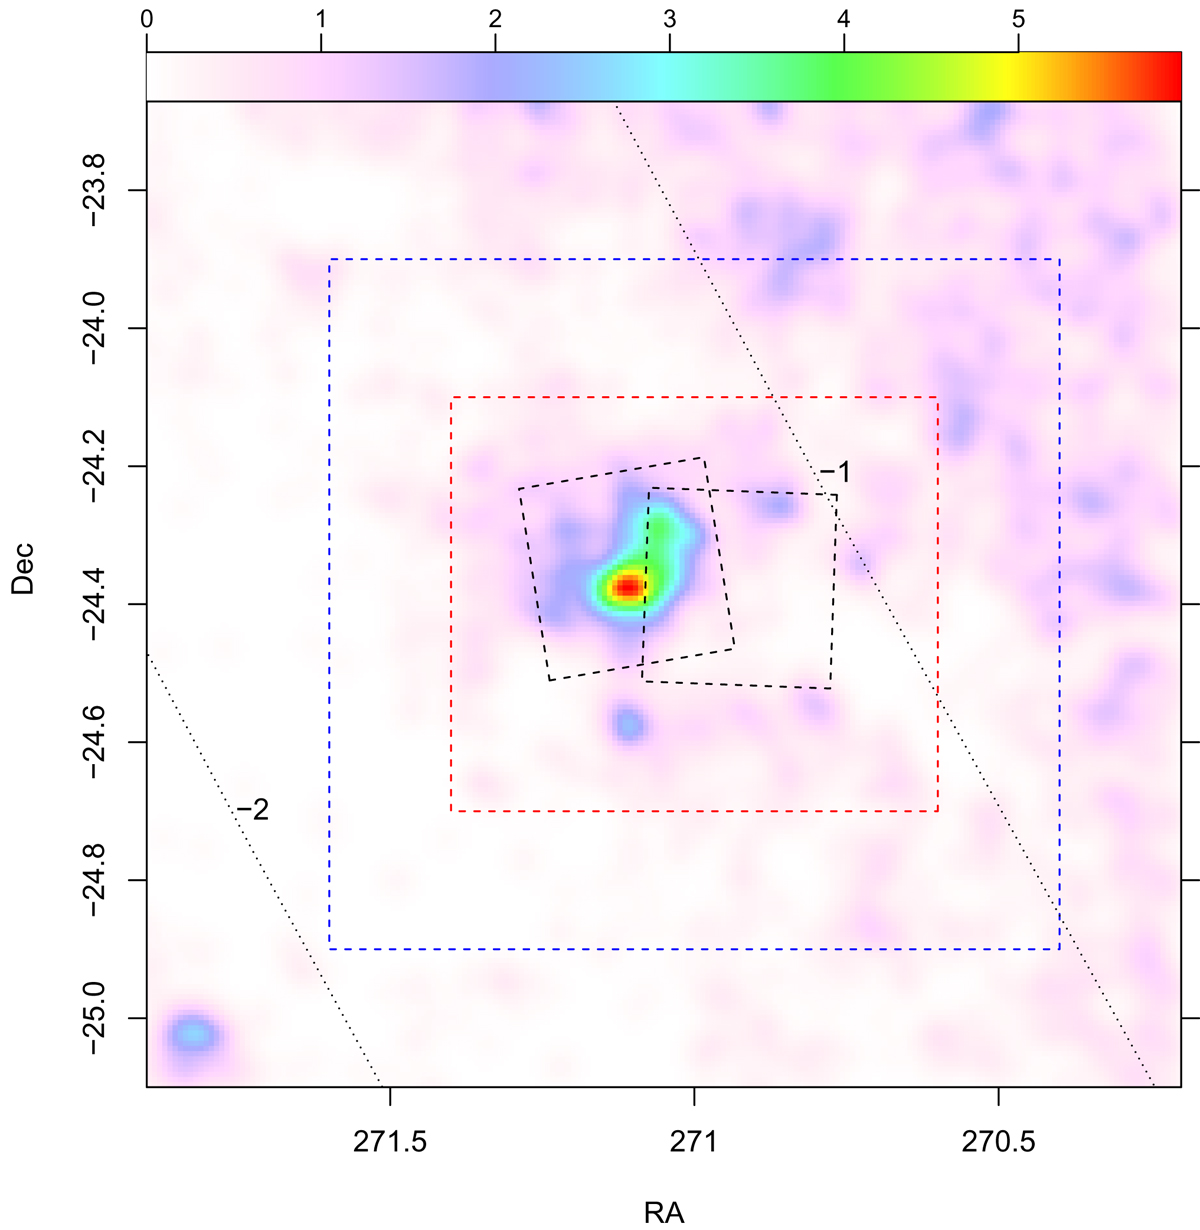
Smoothed density map of all stars with either Hα emission, NIR or UV excesses. The smaller black squares are the Chandra FOVs as in Fig. 1. The red dashed rectangle is a provisional cluster region, while the outer blue rectangle indicates the surrounding reference field-star region. The oblique dotted lines indicate constant Galactic latitude b, as labeled. The enhancement in the lower-left corner corresponds to the globular cluster NGC 6544. Labels in the top-axis colorbar indicate density in units of sources per square arcmin.
Current usage metrics show cumulative count of Article Views (full-text article views including HTML views, PDF and ePub downloads, according to the available data) and Abstracts Views on Vision4Press platform.
Data correspond to usage on the plateform after 2015. The current usage metrics is available 48-96 hours after online publication and is updated daily on week days.
Initial download of the metrics may take a while.