Fig. 4.
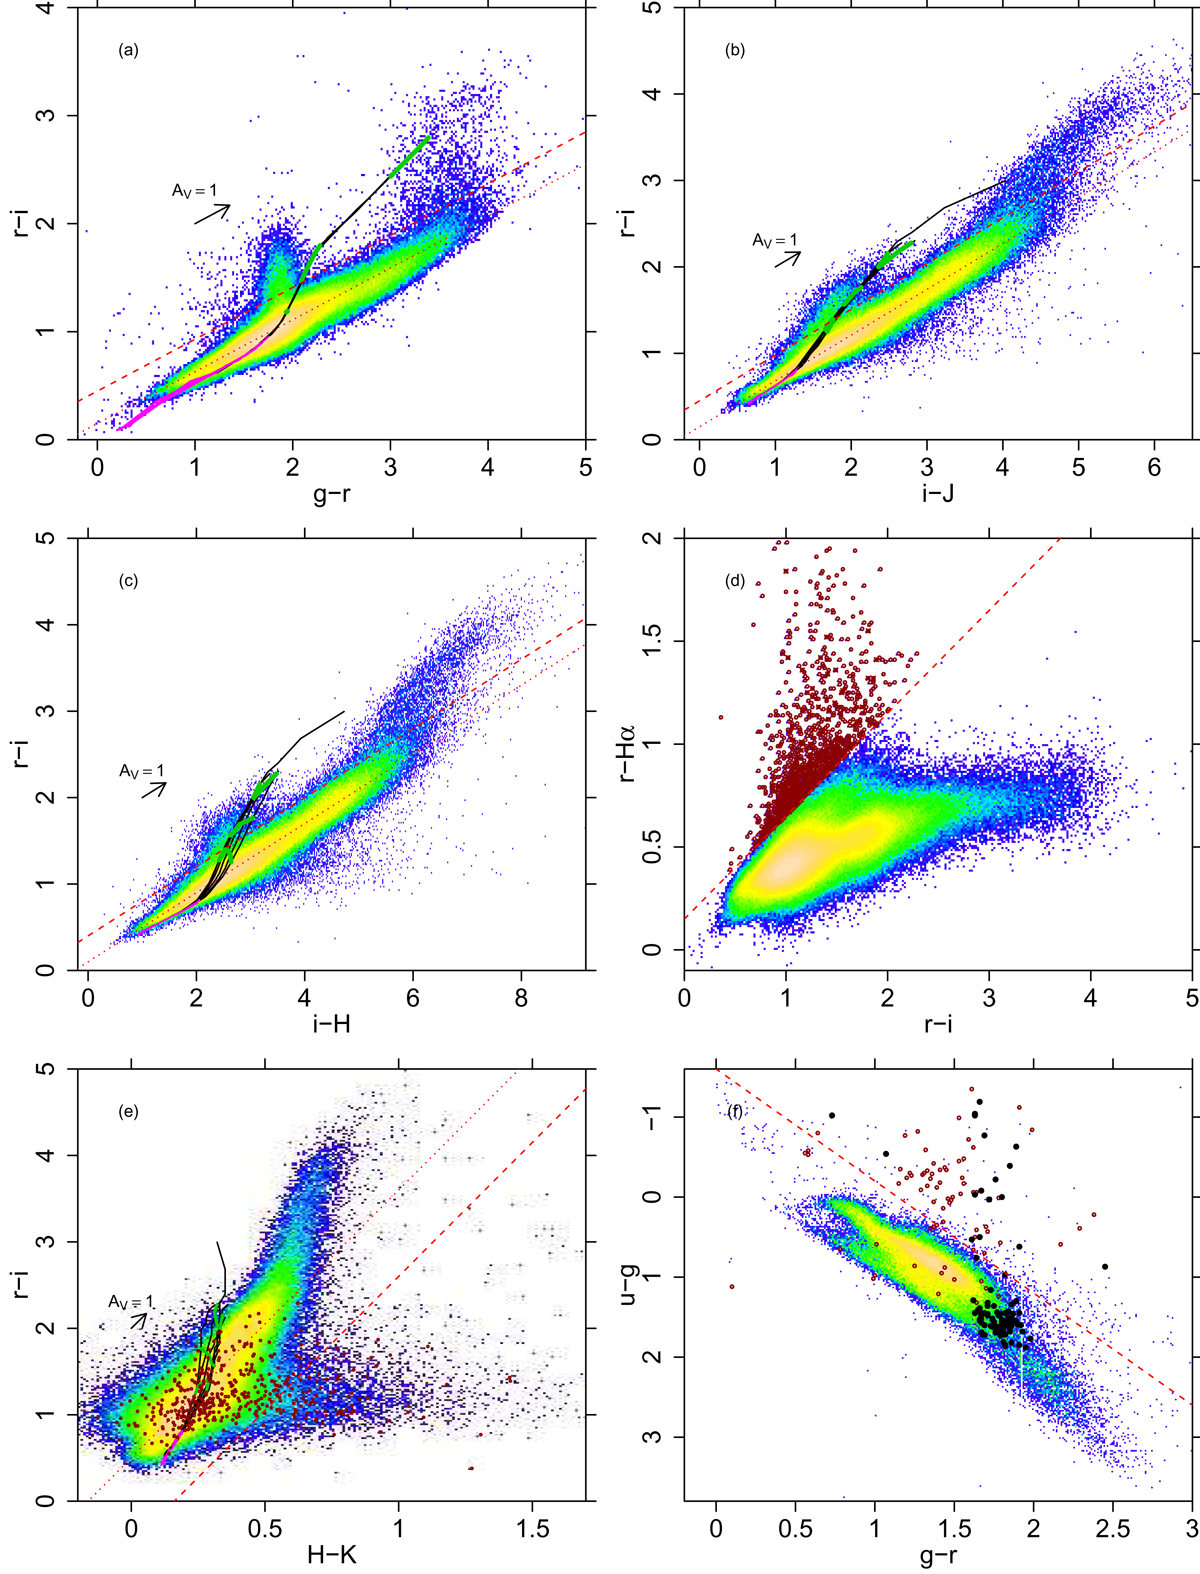
Color–color diagrams used for selection of young stars. Each diagram is a two-dimensional histogram, with colors indicating the density of datapoints. Only data with errors less than 0.1 mag on each pair of colors are shown. The dotted lines, parallel to the reddening vector (except for panel d where no reddening vector is defined), describe the bulk of datapoints. Panels a, b and c: M stars are found above the dashed lines, parallel to the reddening vectors. Panel d: strong Hα-emission stars are found above the dashed line (dark-red points). Panel e: IR-excess stars are found below the dashed line (dark-red points are the same as in panel d). Panel f: (g − r, u − g) color–color diagram for selection of UV-excess stars (above the dashed line). Black dots indicate M stars, while dark-red points are as in panel d. In panels b,c,e: BHAC isochrones (evolutionary tracks) with black (green) lines for ages 1, 10, 50 and 10 000 Myr (masses of 0.1, 0.3, and 0.5 M⊙), reddened as appropriate for NGC 6530 (AV = 1.085). The location of stars with mass M > 1 M⊙ (all ages) is indicated with a magenta curve. In panel a only, Siess et al. (2000) isochrones and tracks are used, the BHAC set being unavailable for the g band.
Current usage metrics show cumulative count of Article Views (full-text article views including HTML views, PDF and ePub downloads, according to the available data) and Abstracts Views on Vision4Press platform.
Data correspond to usage on the plateform after 2015. The current usage metrics is available 48-96 hours after online publication and is updated daily on week days.
Initial download of the metrics may take a while.