Fig. 19.
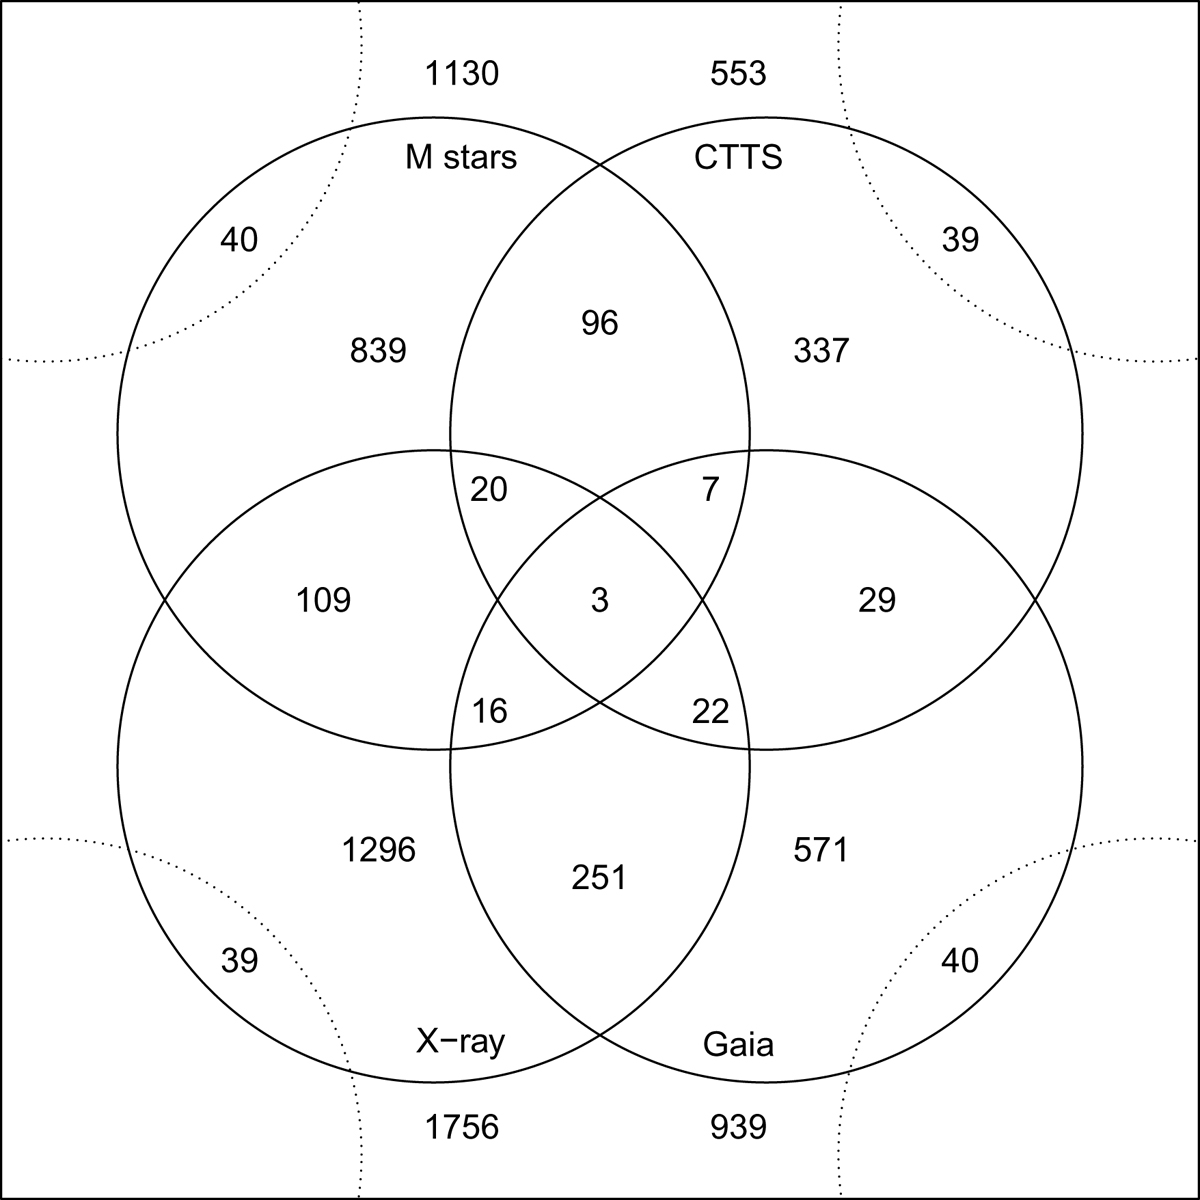
Venn diagram showing the intersections among the different member subsamples. The total number of candidate members for each subsample is shown outside the corresponding circle, near its label. The diagram wraps around its corners, in order to show the exclusive intersections between X-ray and CTTS samples, and between Gaia and M-star samples.
Current usage metrics show cumulative count of Article Views (full-text article views including HTML views, PDF and ePub downloads, according to the available data) and Abstracts Views on Vision4Press platform.
Data correspond to usage on the plateform after 2015. The current usage metrics is available 48-96 hours after online publication and is updated daily on week days.
Initial download of the metrics may take a while.