Fig. 18.
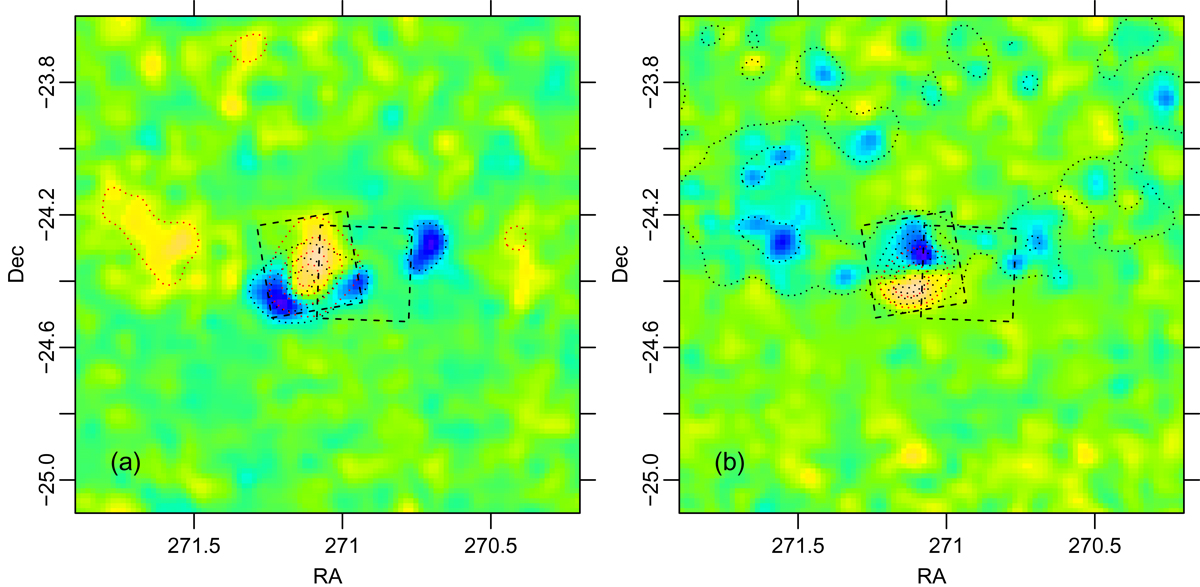
Panel a: difference between spatial distributions of Gaia members (according to both proper motion and parallax) with μα less and above 1.33 mas yr−1, respectively. Only Gaia sources with μα errors less than 0.5 mas yr−1 are considered. In blue (yellow) are negative (positive) values, with green indicating zero difference. Dashed squares are the Chandra FOVs. The red and black dotted contours describe the original distributions in the two μα ranges, whose difference is shown by the map. Panel b: same as panel a, but showing the difference between distributions of stars with μδ less and above −2.0 mas yr−1.
Current usage metrics show cumulative count of Article Views (full-text article views including HTML views, PDF and ePub downloads, according to the available data) and Abstracts Views on Vision4Press platform.
Data correspond to usage on the plateform after 2015. The current usage metrics is available 48-96 hours after online publication and is updated daily on week days.
Initial download of the metrics may take a while.