Fig. 14.
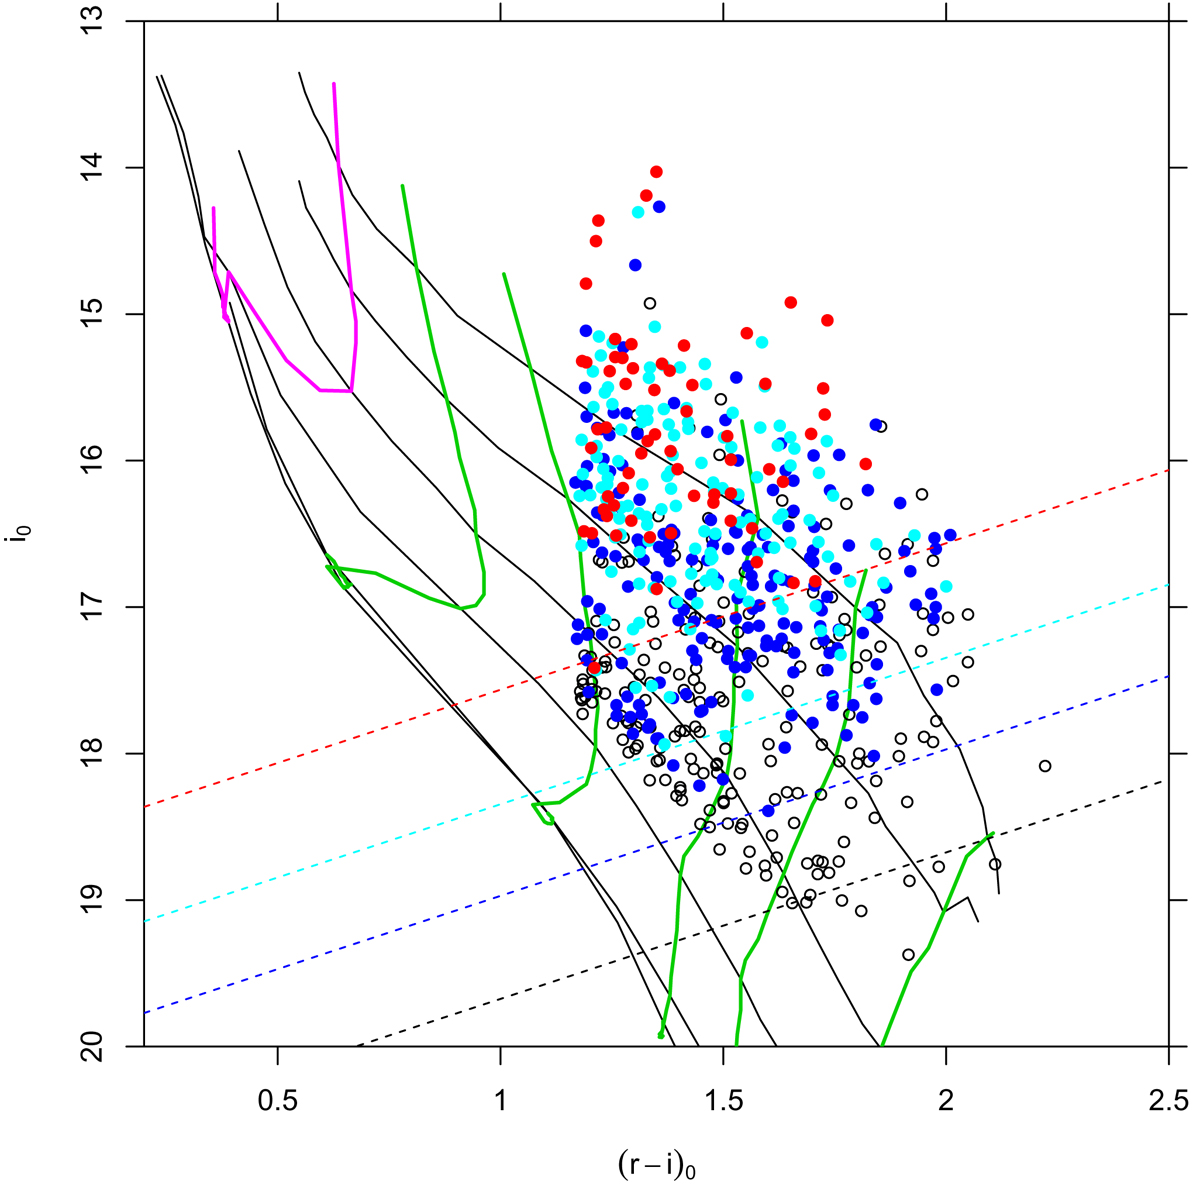
Dereddened CMD for M stars in final cluster region defined in Fig. 12. Evolutionary tracks and isochrones as in the same figure, but with zero reddening. Colored dots are individually-dereddened M stars, with color-coded extinction ranges. Black: 0.0 < AV < 0.8; blue: 0.8 < AV < 1.7; cyan: 1.7 < AV < 2.5; red: 2.5 < AV < 3.5. Oblique dashed lines indicate completeness limits for the same AV ranges.
Current usage metrics show cumulative count of Article Views (full-text article views including HTML views, PDF and ePub downloads, according to the available data) and Abstracts Views on Vision4Press platform.
Data correspond to usage on the plateform after 2015. The current usage metrics is available 48-96 hours after online publication and is updated daily on week days.
Initial download of the metrics may take a while.