Fig. 13.
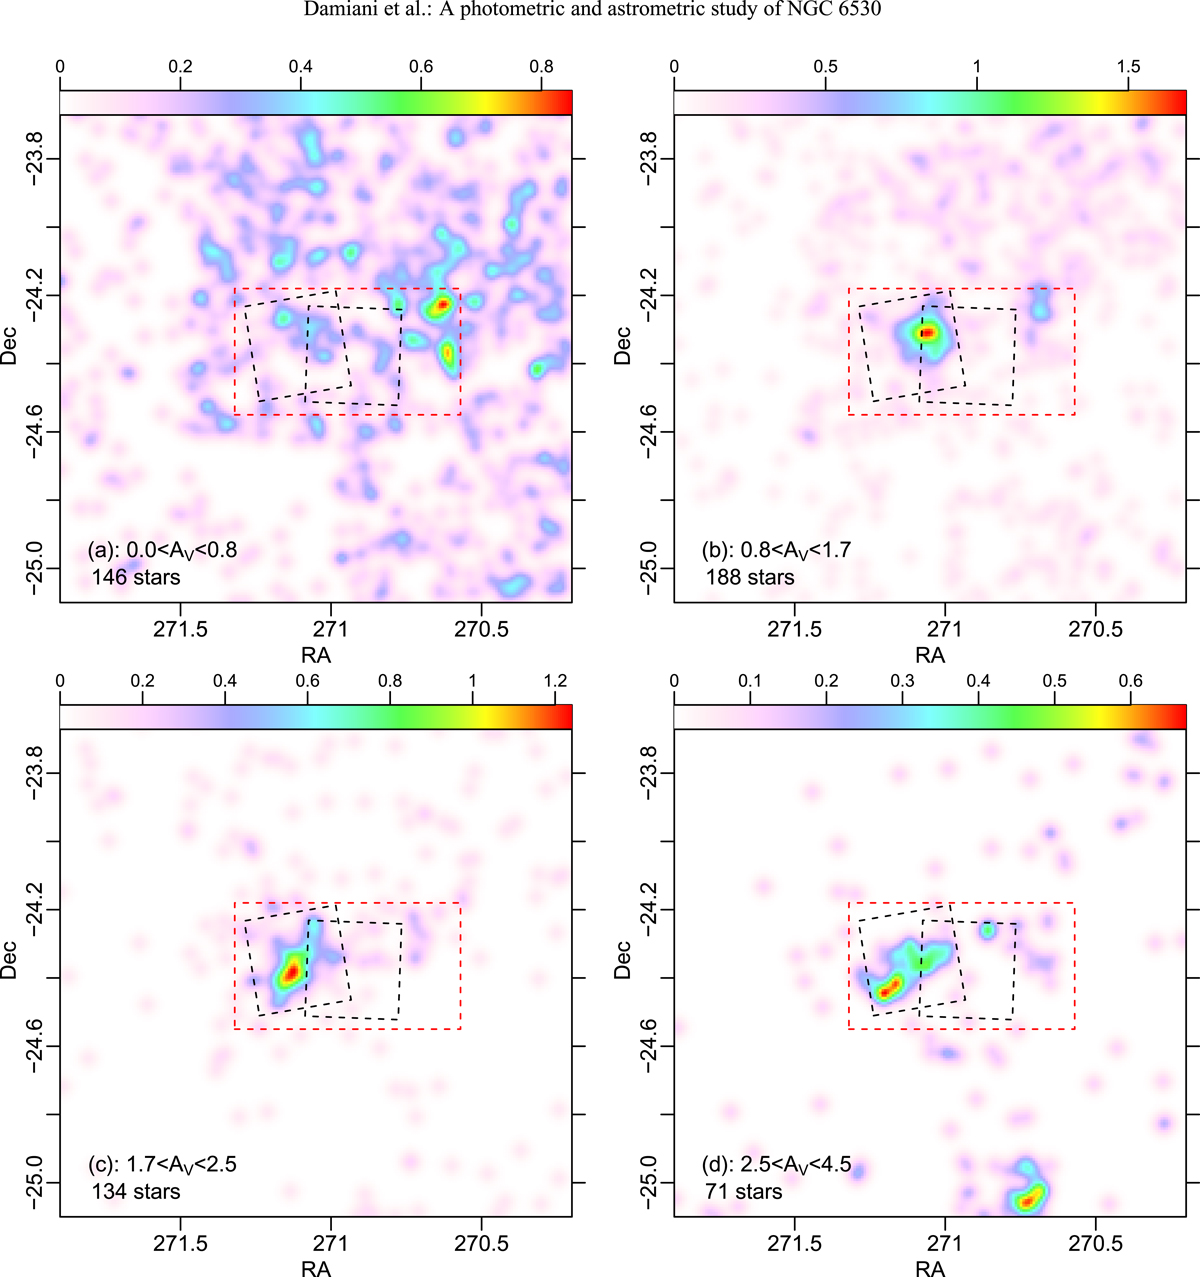
Maps of spatial distribution of low-reddening M stars, for different AV ranges. For AV > 4.5 mag (not shown), there is no sign of clustering around the NGC 6530 position. Dashed squares are the Chandra FOVs. The dashed red rectangle is the cluster region as in Fig. 12. The number of M stars in this region is indicated for each AV range.
Current usage metrics show cumulative count of Article Views (full-text article views including HTML views, PDF and ePub downloads, according to the available data) and Abstracts Views on Vision4Press platform.
Data correspond to usage on the plateform after 2015. The current usage metrics is available 48-96 hours after online publication and is updated daily on week days.
Initial download of the metrics may take a while.