Fig. 11.
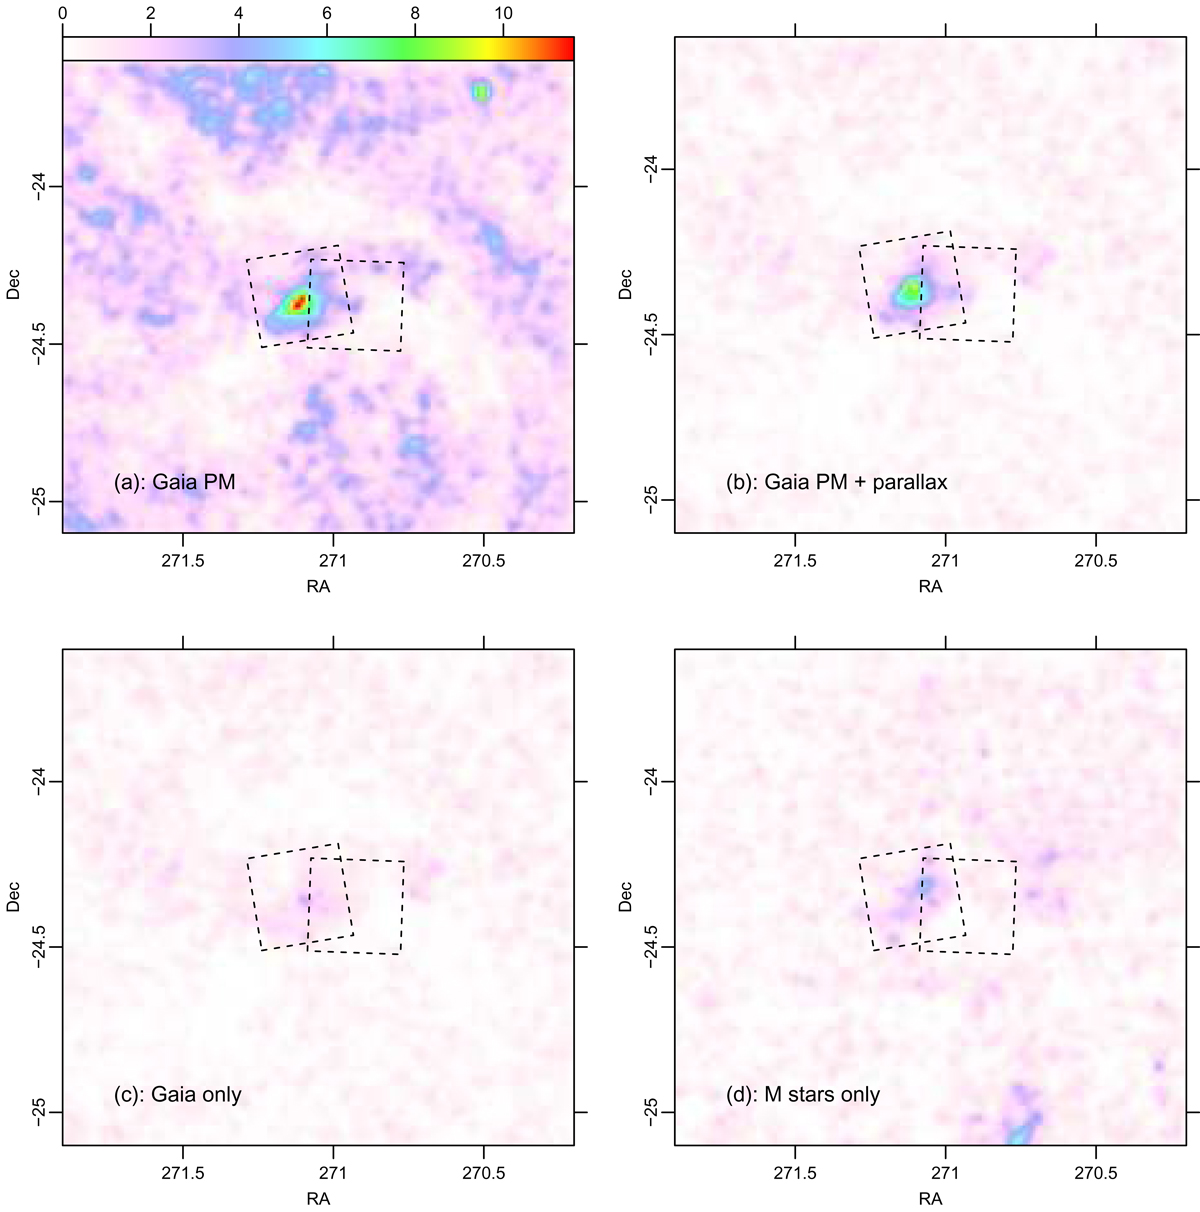
Spatial distributions of subsamples selected according to various criteria. Dashed squares are the Chandra FOVs. The color scale is the same for all panels. Panel a: all Gaia sources selected from proper motion alone, falling inside the rectangle in Fig. 7b. and errors on μα and μα less than 0.5. Top-axis colorbar as in Fig. 6. Panel b: Gaia sources selected from proper motion and parallax, falling inside both rectangles of Fig. 7b and c. Panel c: Gaia sources as in panel b, but missed by the X-ray, CTTS, and M-star selection methods. Panel d: M stars missed by the Gaia, X-ray, and CTTS selection methods.
Current usage metrics show cumulative count of Article Views (full-text article views including HTML views, PDF and ePub downloads, according to the available data) and Abstracts Views on Vision4Press platform.
Data correspond to usage on the plateform after 2015. The current usage metrics is available 48-96 hours after online publication and is updated daily on week days.
Initial download of the metrics may take a while.