Fig. 1.
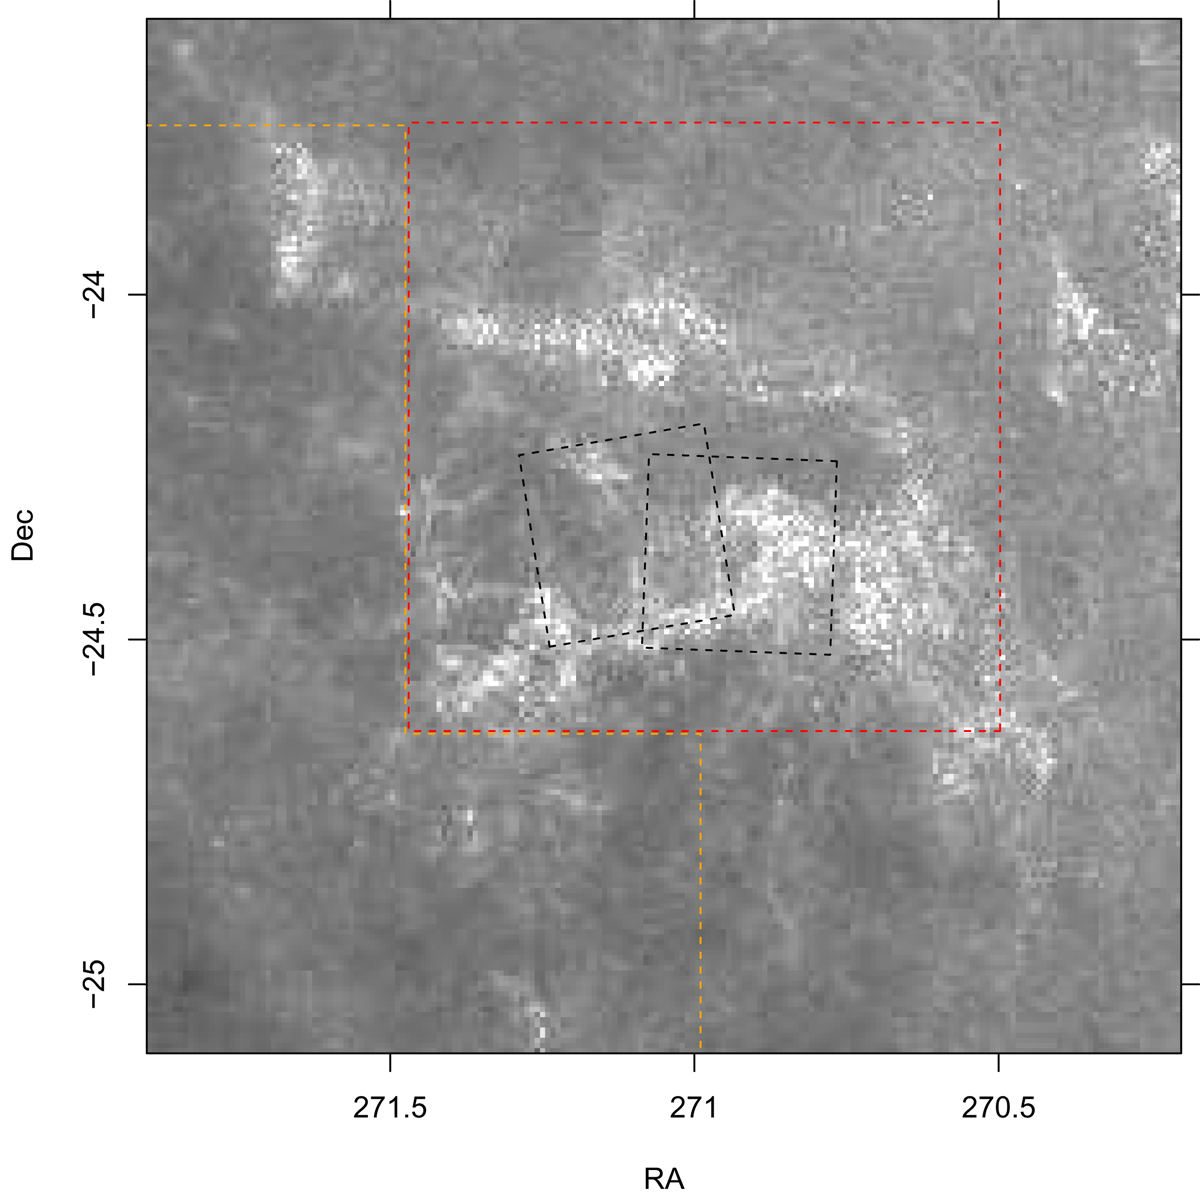
Spatial density of all Gaia sources in the region studied. Light-gray corresponds to the lowest source density. The two dashed black squares are the Chandra ACIS-I FOVs. The dashed red rectangle indicates the sky region with NIR data from King et al. (2013), while the southeastern region delimited by the dashed orange line has only VVV NIR data.
Current usage metrics show cumulative count of Article Views (full-text article views including HTML views, PDF and ePub downloads, according to the available data) and Abstracts Views on Vision4Press platform.
Data correspond to usage on the plateform after 2015. The current usage metrics is available 48-96 hours after online publication and is updated daily on week days.
Initial download of the metrics may take a while.