Fig. 8
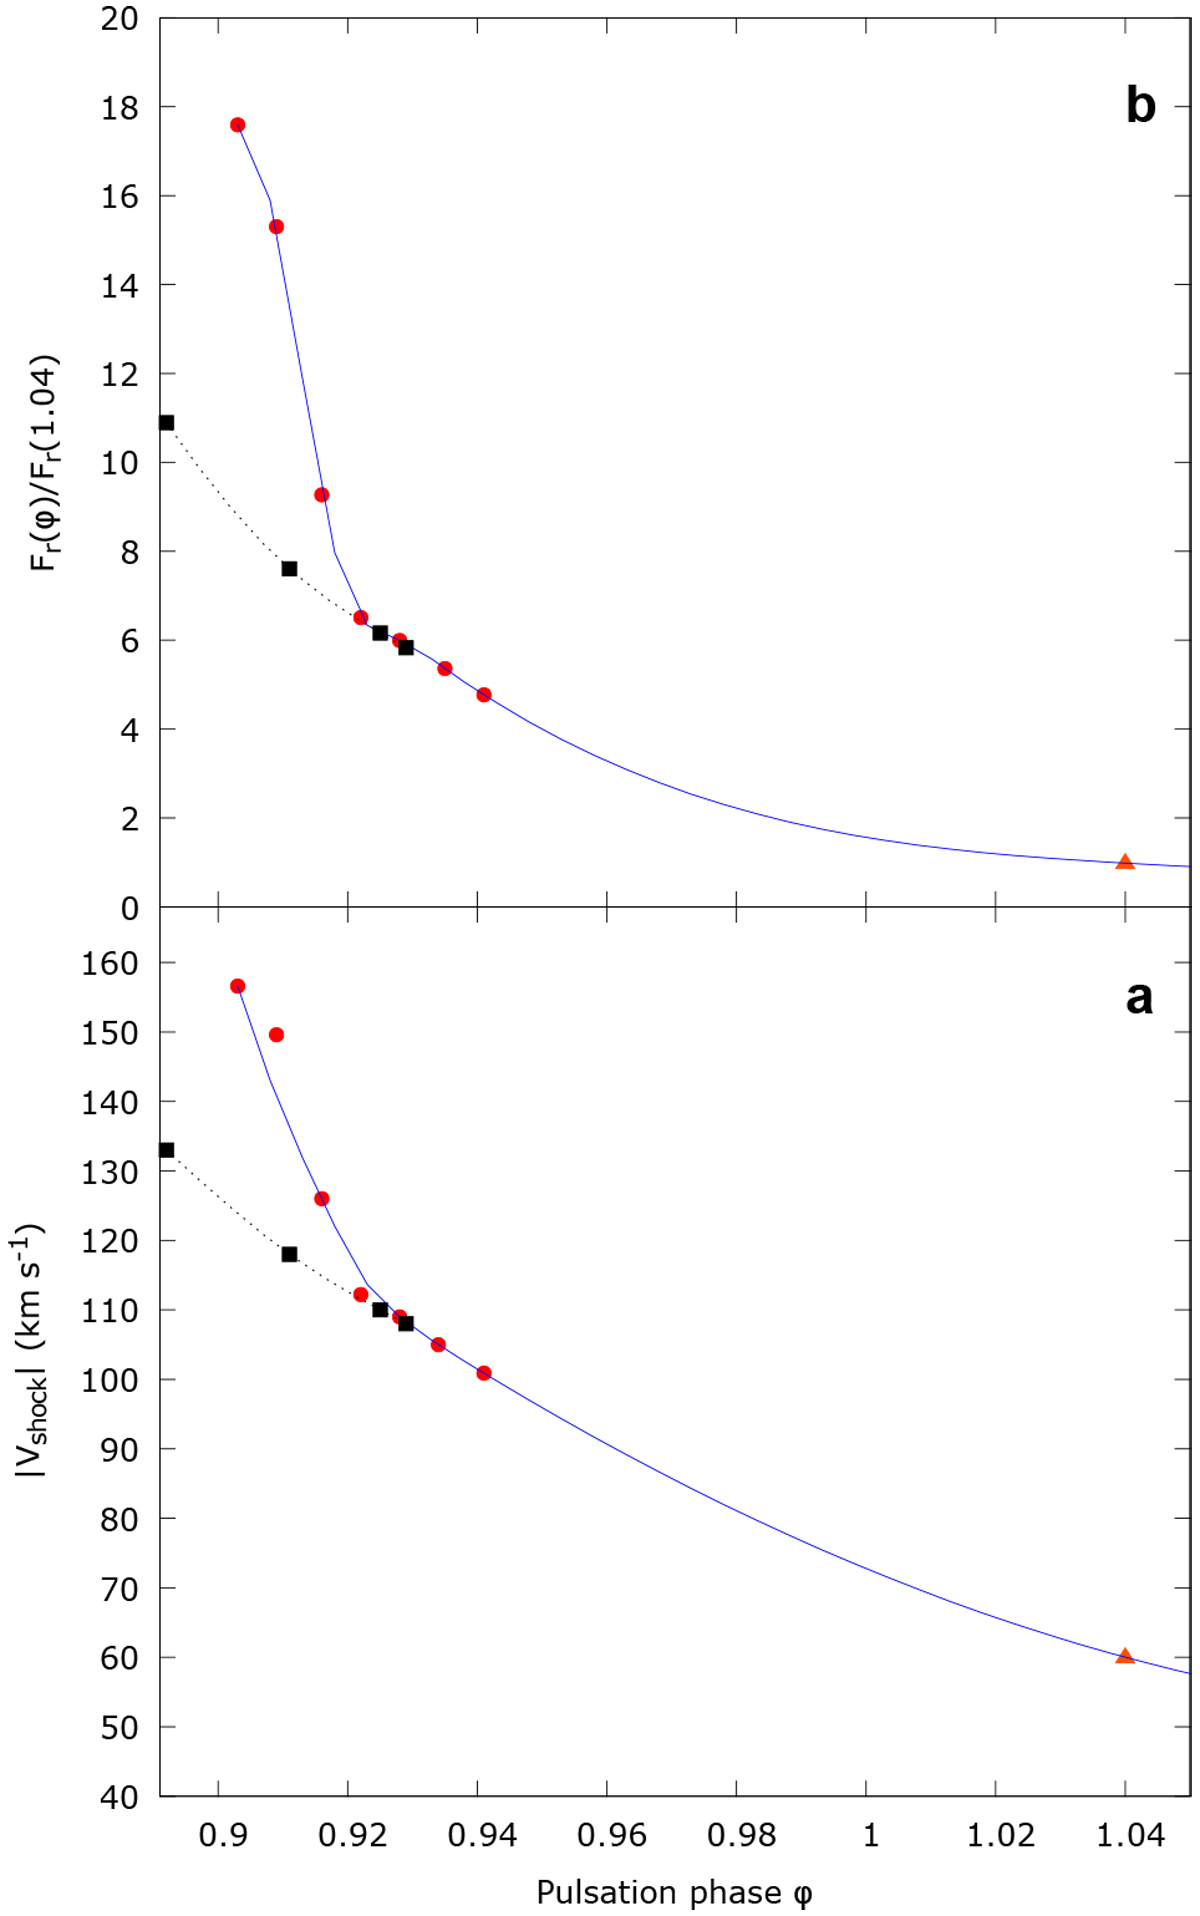
Phased kinetic and radiative flux measurements with trend curve. Measurements points are the most probable values of |Vshock| and Fr (φ)∕Fr(1.04). Associated uncertainties are computed in Tables 8 and 6. Red dots are measured values from August 13, 2014 while the red triangle represents the night of October 12, 2013. Velocities from April 2017 are black squares with the corresponding trend curve (grey dotted line). Panel a: evolution of |Vshock| plotted with a cubic spline interpolation curve. In the phase interval φ = 0.90−0.92, Vshock decreases much more than in the phase interval φ = 0.92−1.04. Thus, for 40% of the period, the shock front velocity decreases by a factor of more than three. Panel b: evolution of maximum values of Fr(φ)∕Fr(1.04) ratio plotted with a cubic spline interpolation curve. In the phase interval φ = 0.90−0.92, the Fr ratio decreases much more than in the phase interval φ = 0.92−1.04. The flow of radiative losses increases rapidly with the speed of the shock front.
Current usage metrics show cumulative count of Article Views (full-text article views including HTML views, PDF and ePub downloads, according to the available data) and Abstracts Views on Vision4Press platform.
Data correspond to usage on the plateform after 2015. The current usage metrics is available 48-96 hours after online publication and is updated daily on week days.
Initial download of the metrics may take a while.