Fig. 1
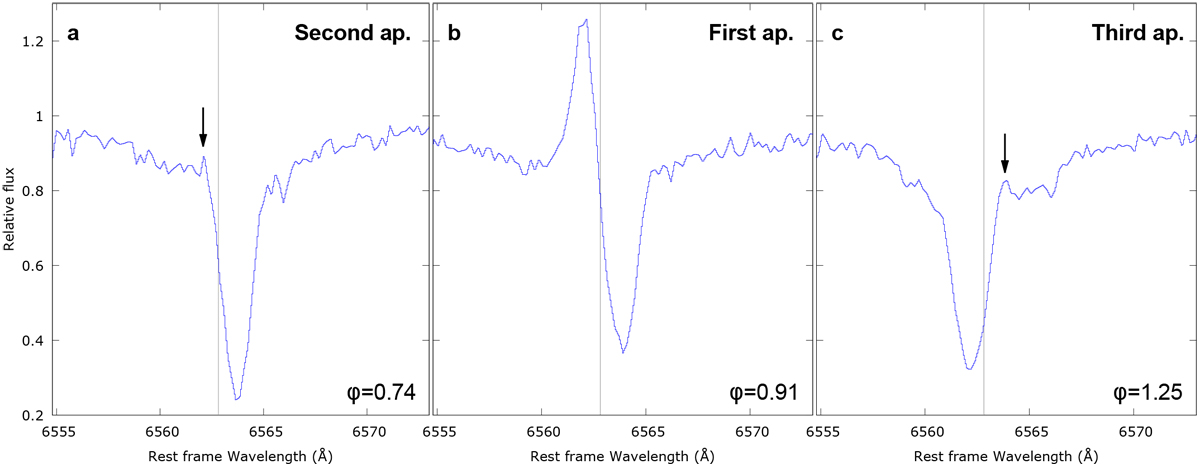
Comparison of the three apparitions of Hα line profile of RR Lyr. Panel a: second apparition at φ = 0.74 represented with a spectrum dated on April 10, 2017. Panel b: first apparition at φ = 0.91 represented with a spectrum dated on April 09, 2017. Panel c: third apparition at φ = 1.25 represented with a spectrum dated on April 08, 2017. Vertical line indicates the Hα line laboratory wavelength.
Current usage metrics show cumulative count of Article Views (full-text article views including HTML views, PDF and ePub downloads, according to the available data) and Abstracts Views on Vision4Press platform.
Data correspond to usage on the plateform after 2015. The current usage metrics is available 48-96 hours after online publication and is updated daily on week days.
Initial download of the metrics may take a while.