Free Access
Fig. 6.
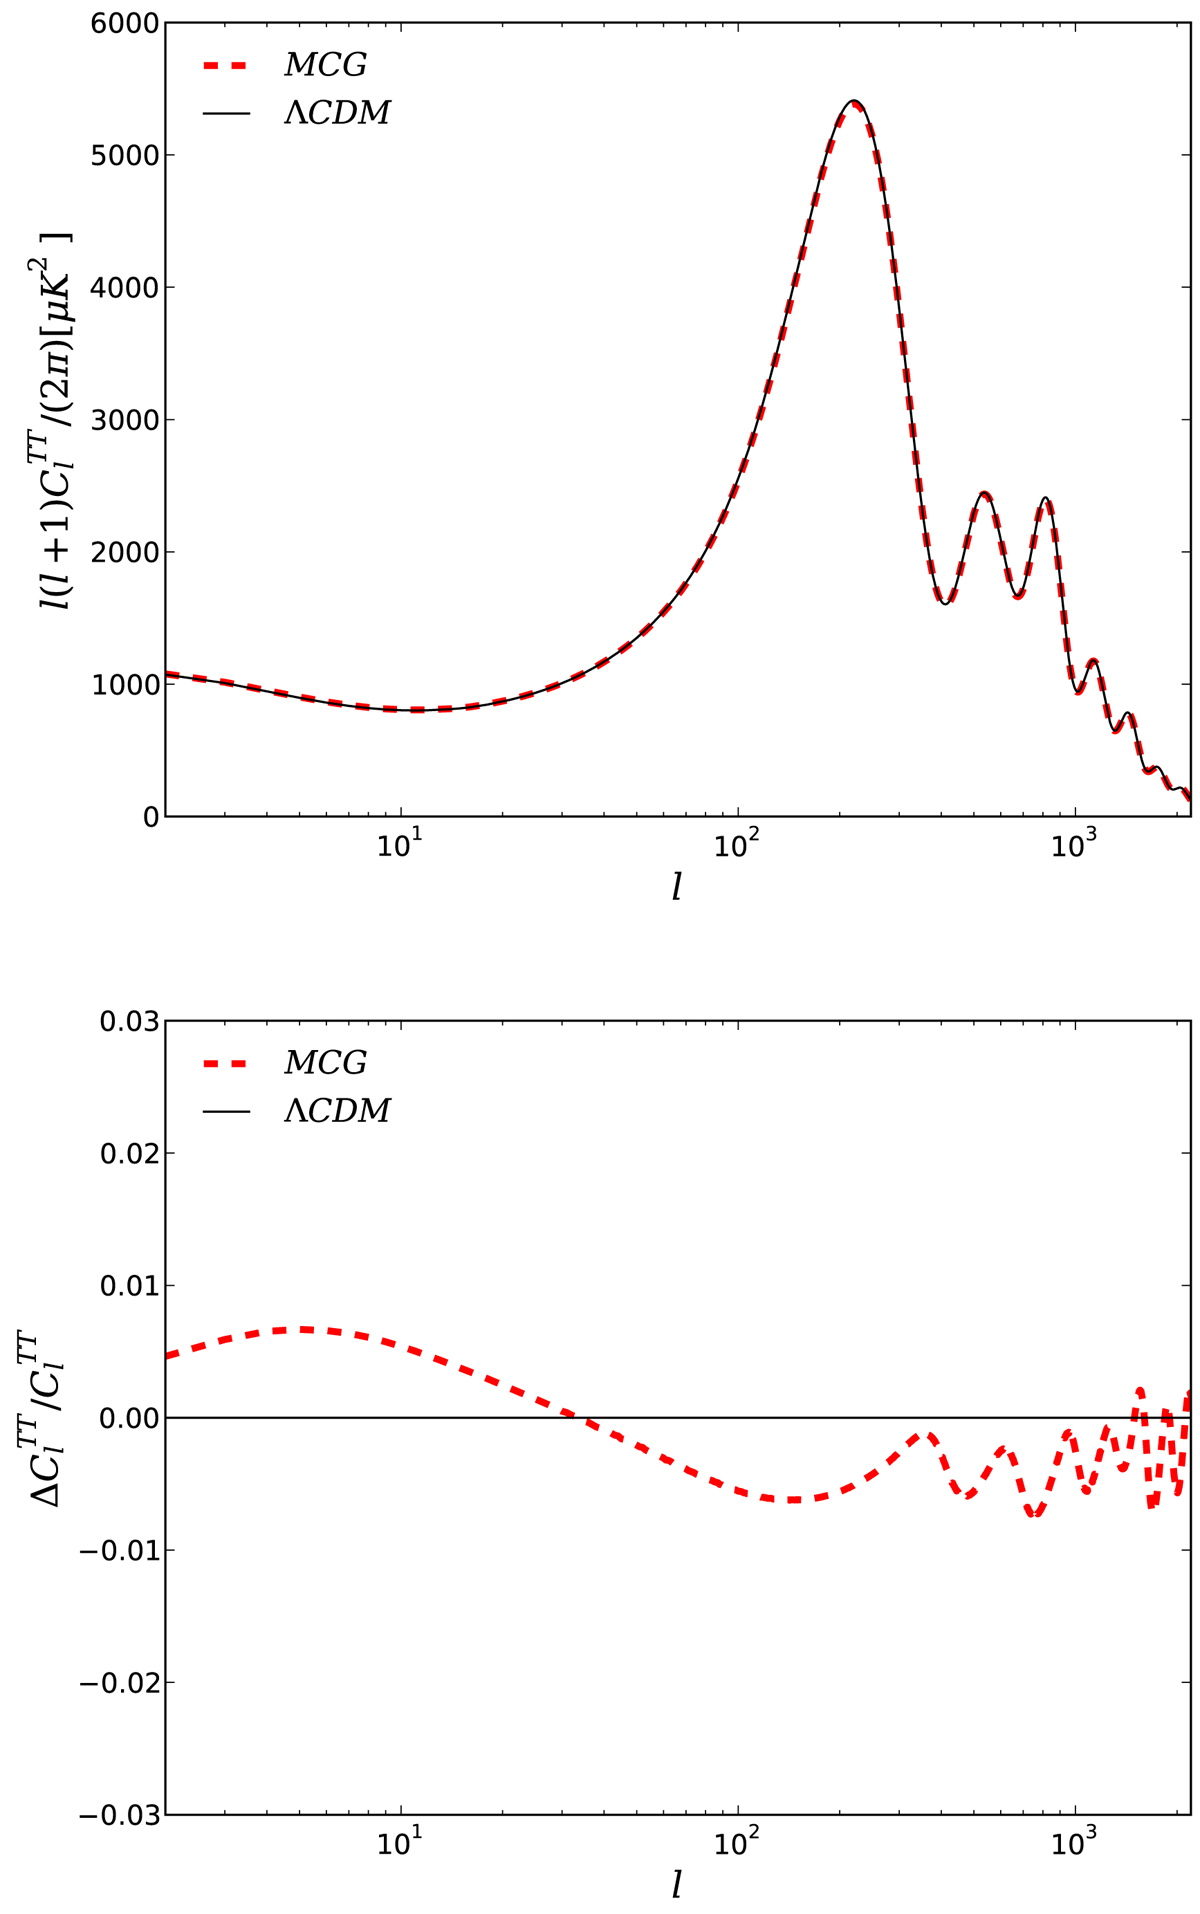
CMB temperature power spectrum vs. multiple moment l, the red solid line is for the unified dark fluid model with mean values of CMB+JLA+CC as shown in Table 1, the black dashed line is for the ΛCDM model with the same observational combination.
Current usage metrics show cumulative count of Article Views (full-text article views including HTML views, PDF and ePub downloads, according to the available data) and Abstracts Views on Vision4Press platform.
Data correspond to usage on the plateform after 2015. The current usage metrics is available 48-96 hours after online publication and is updated daily on week days.
Initial download of the metrics may take a while.