Fig. 5.
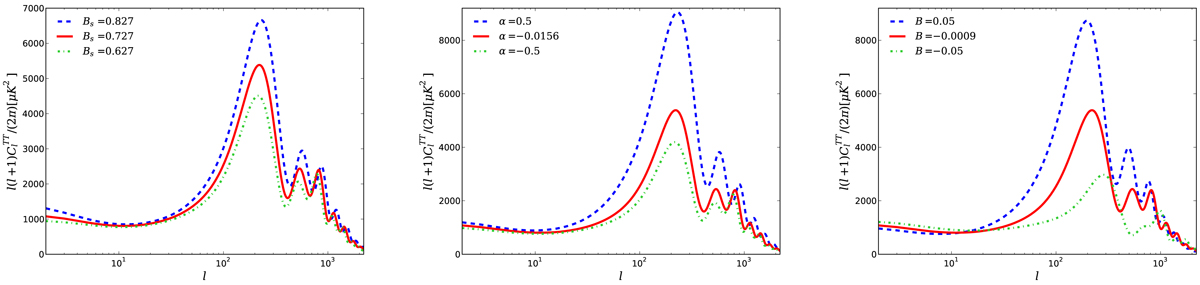
Effects on CMB temperature power spectra for the different values of the model parameter α and Bs. In the left figure, the blue dashed, red solid, and green dotted-dashed lines are for Bs = 0.827, 0.727, 0.627, respectively; in the middle figure, the blue dashed, red solid, and green dotted-dashed lines are for α = 0.5, −0.0156, −0.5, respectively; in the right figure, the blue dashed, red solid, and green dotted-dashed lines are for B = 0.05, −0.0009, −0.05, respectively; the other relevant parameters are fixed with the mean values of CMB+JLA+CC as shown in Table 1.
Current usage metrics show cumulative count of Article Views (full-text article views including HTML views, PDF and ePub downloads, according to the available data) and Abstracts Views on Vision4Press platform.
Data correspond to usage on the plateform after 2015. The current usage metrics is available 48-96 hours after online publication and is updated daily on week days.
Initial download of the metrics may take a while.