Fig. 4.
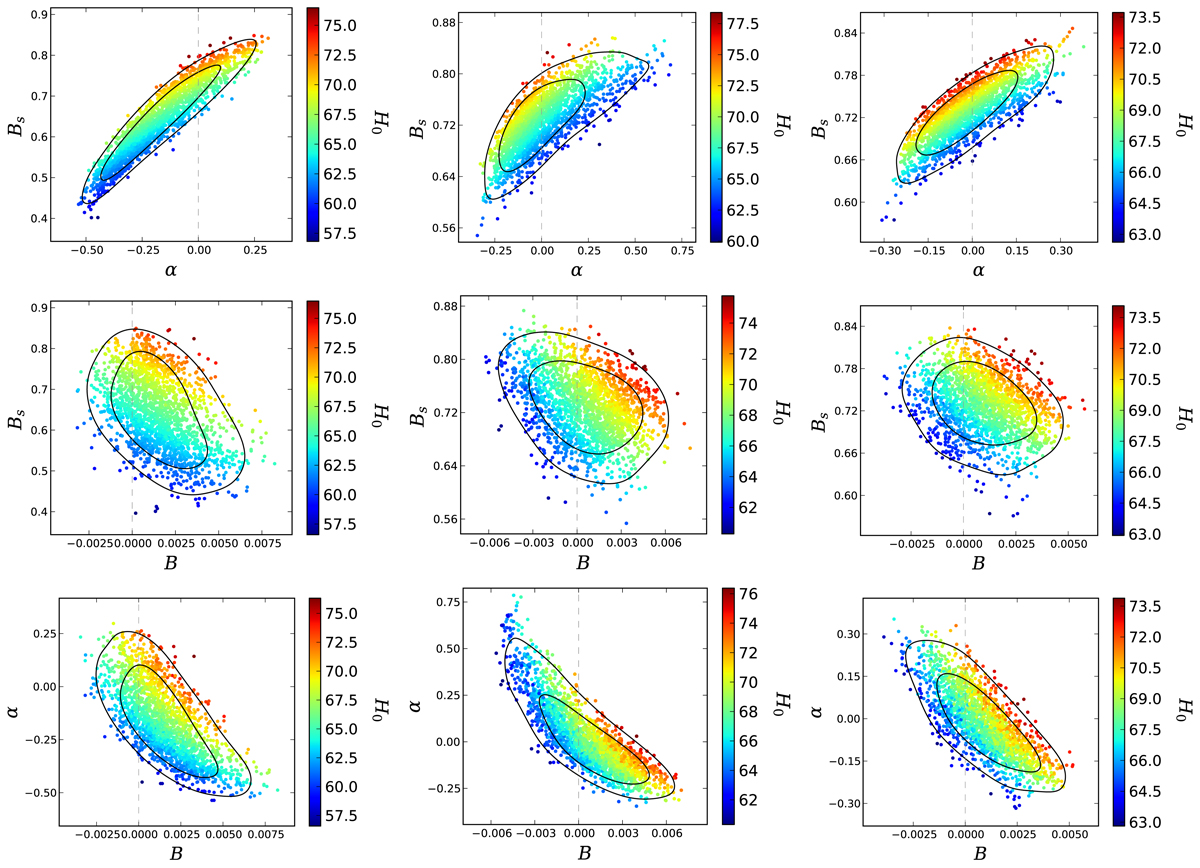
Three-dimensional figures with colors of MCG model between the parameters pair Bs, α, B and derived parameter H0 for three different observational combination, the dashed vertical line is corresponding to the parameter α = 0 or B = 0, whose results, from left to right, are obtained by the different combination of observational data sets CMB+CC (left panel), CMB+JLA (middle panel), and CMB+JLA+CC (right panel).
Current usage metrics show cumulative count of Article Views (full-text article views including HTML views, PDF and ePub downloads, according to the available data) and Abstracts Views on Vision4Press platform.
Data correspond to usage on the plateform after 2015. The current usage metrics is available 48-96 hours after online publication and is updated daily on week days.
Initial download of the metrics may take a while.