Free Access
Fig. 3.
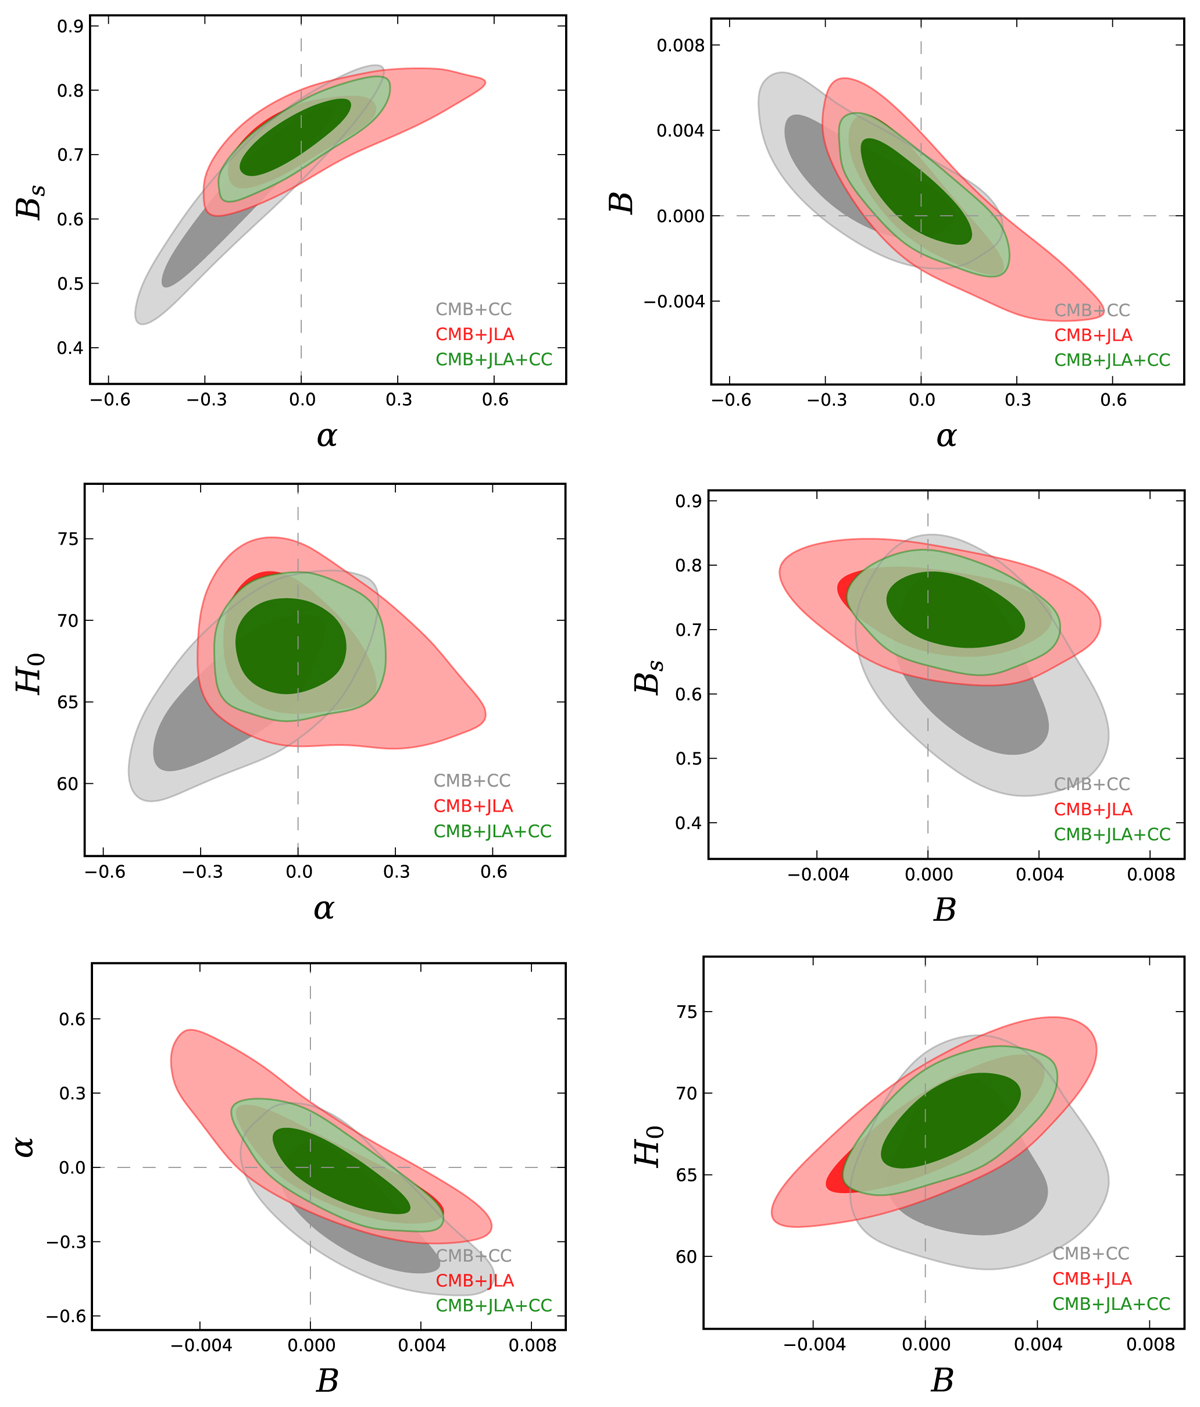
Two-dimensional contours of MCG model at 1σ and 2σ regions for the parameters pair, the dashed vertical line is corresponding to the parameter α = 0 or B = 0, whose results are obtained by the different combination of observational data sets CMB+CC (gray contour), CMB+JLA (red contour), and CMB+JLA+CC (green contour).
Current usage metrics show cumulative count of Article Views (full-text article views including HTML views, PDF and ePub downloads, according to the available data) and Abstracts Views on Vision4Press platform.
Data correspond to usage on the plateform after 2015. The current usage metrics is available 48-96 hours after online publication and is updated daily on week days.
Initial download of the metrics may take a while.