Fig. 6
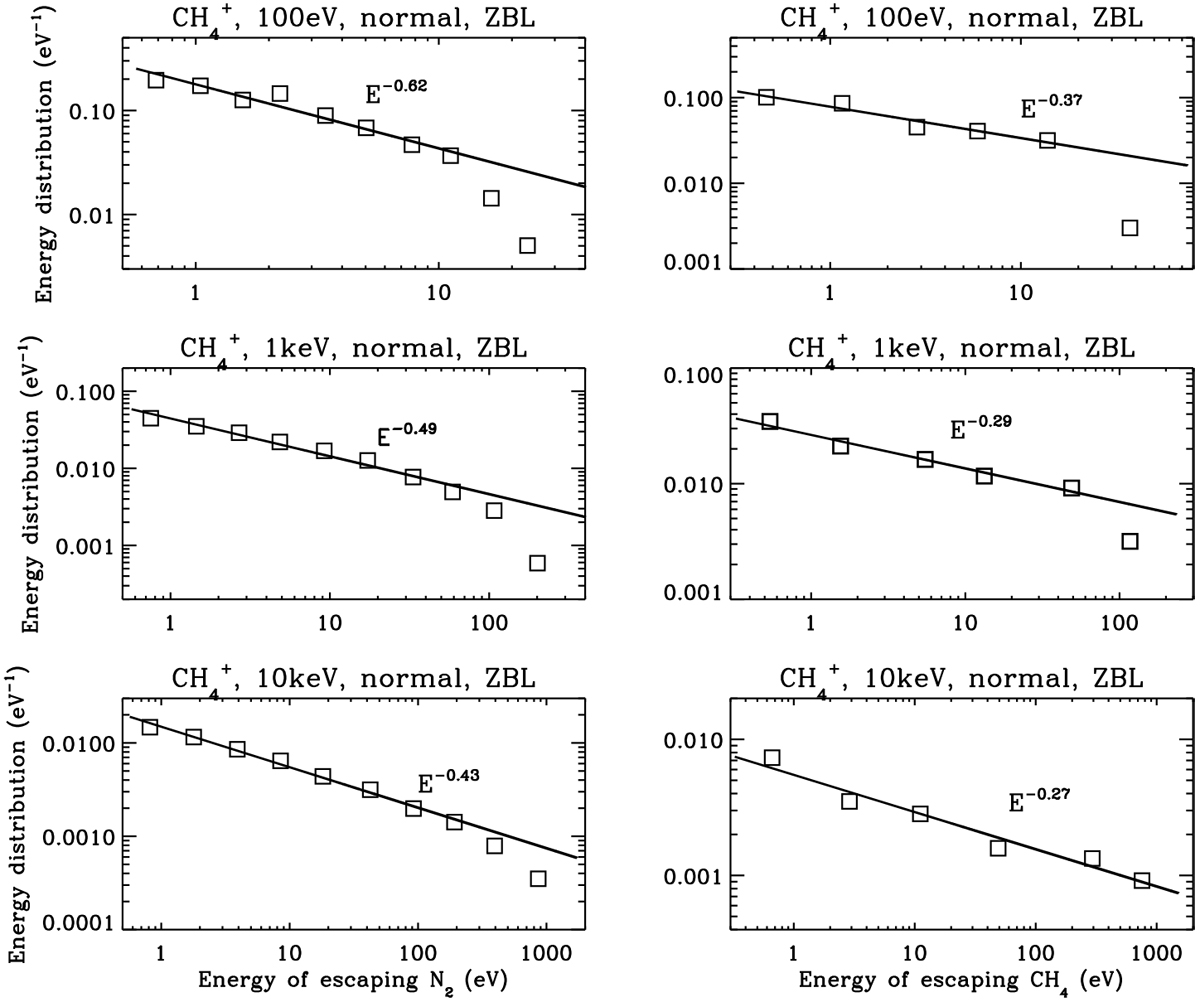
Several examples of the energy distribution of escaping molecules for three different incidence energies including 100 eV, 1 keV, and 10 keV, all assuming normal incidence. Distributions of escaping N2 and CH4 molecules are shown separately in the left and right panels, respectively. The probability distribution tends to decline near monotonically with increasing energy, which is reasonably well described by a power law as given by the thick solid line in each panel. Such a power law trend extends all the way from the local escape energy to a turnoff energy above which the distribution declines rapidly to zero. The best-fit power index is indicated in each panel for reference.
Current usage metrics show cumulative count of Article Views (full-text article views including HTML views, PDF and ePub downloads, according to the available data) and Abstracts Views on Vision4Press platform.
Data correspond to usage on the plateform after 2015. The current usage metrics is available 48-96 hours after online publication and is updated daily on week days.
Initial download of the metrics may take a while.