Open Access
Fig. 5.
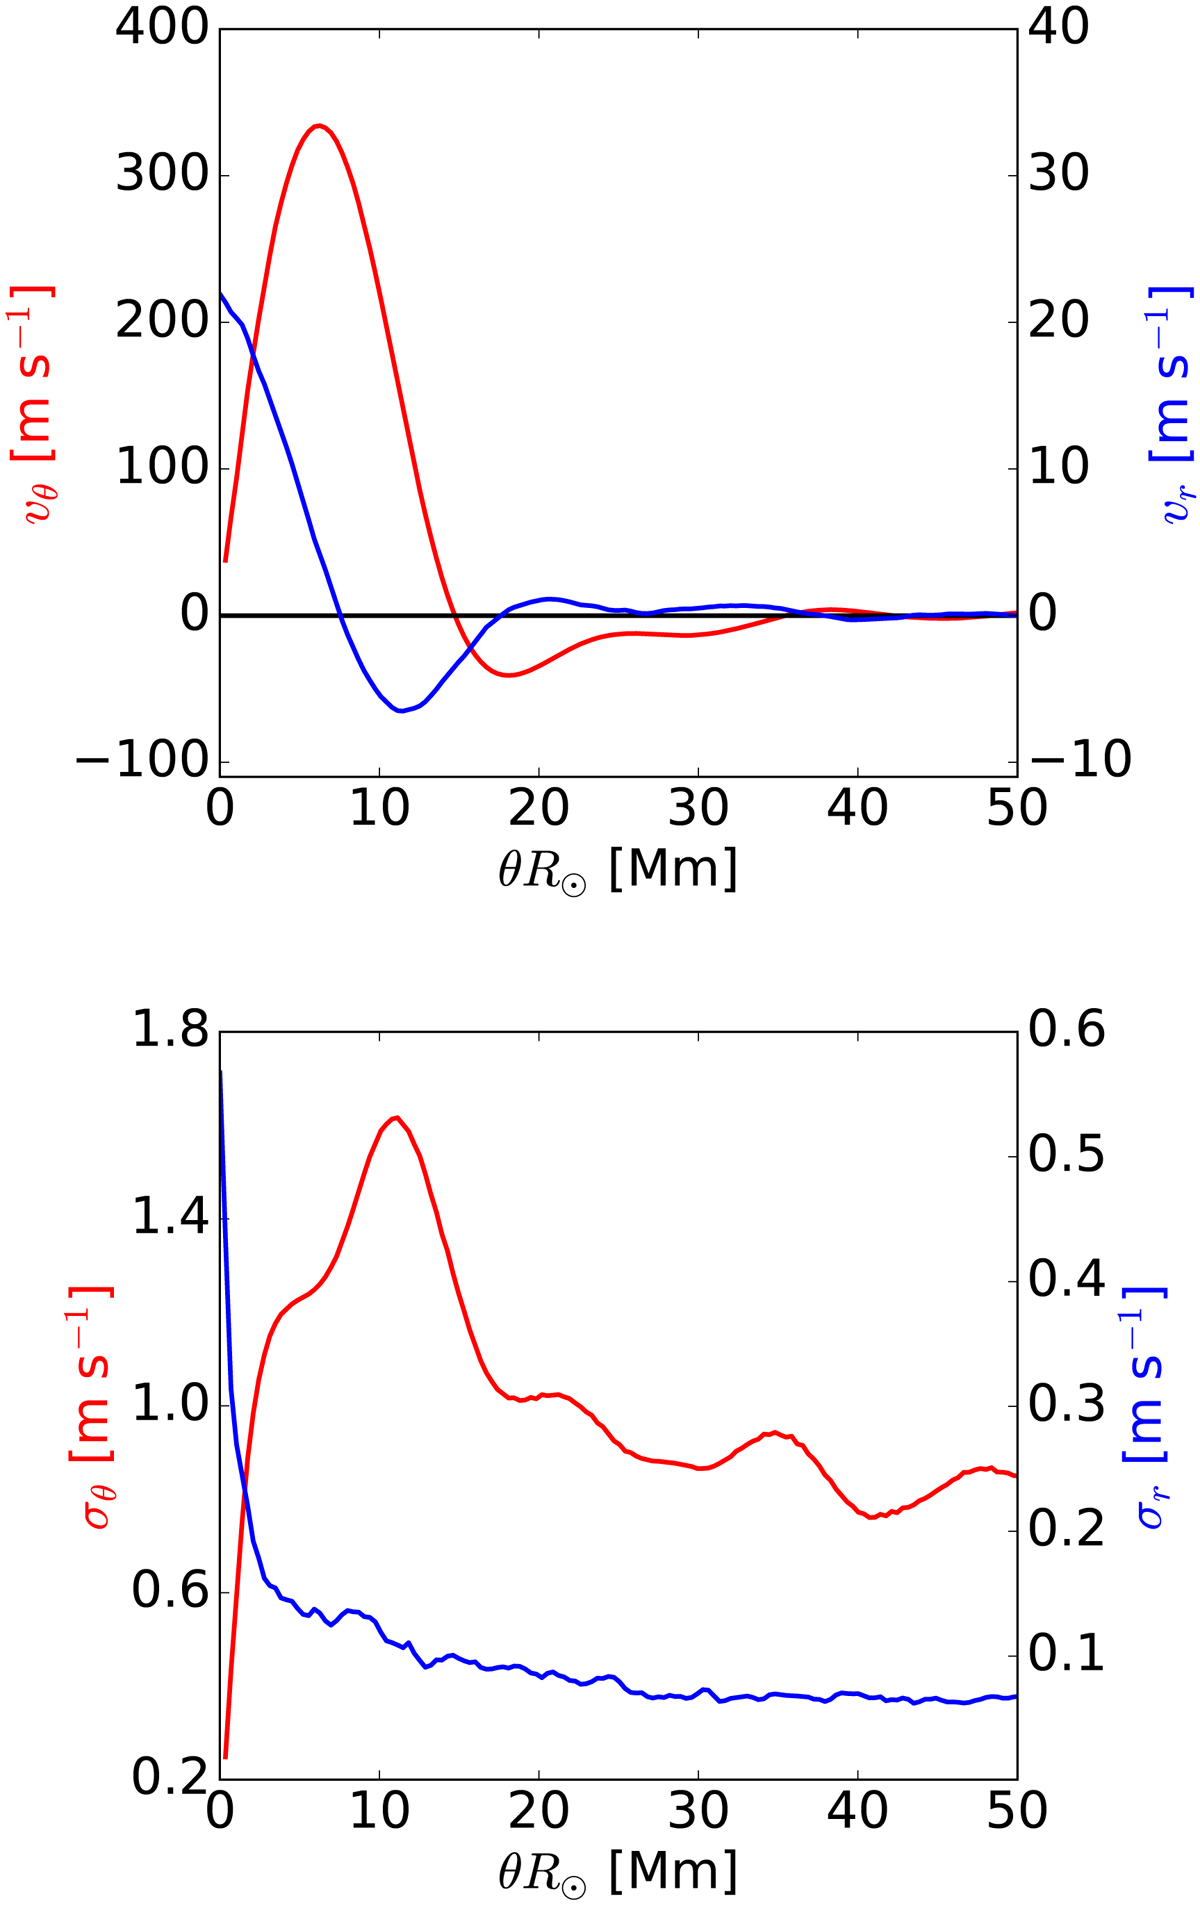
Top panel: observed vertical velocity vr (blue curve) and horizontal velocity vθ (red curve) for an average supergranule as a function of the surface distance θR⊙ from the center of the supergranule. Bottom panel: error estimates on the LCT observations (red curve) and Doppler observations (blue curve).
Current usage metrics show cumulative count of Article Views (full-text article views including HTML views, PDF and ePub downloads, according to the available data) and Abstracts Views on Vision4Press platform.
Data correspond to usage on the plateform after 2015. The current usage metrics is available 48-96 hours after online publication and is updated daily on week days.
Initial download of the metrics may take a while.