Fig. 2.
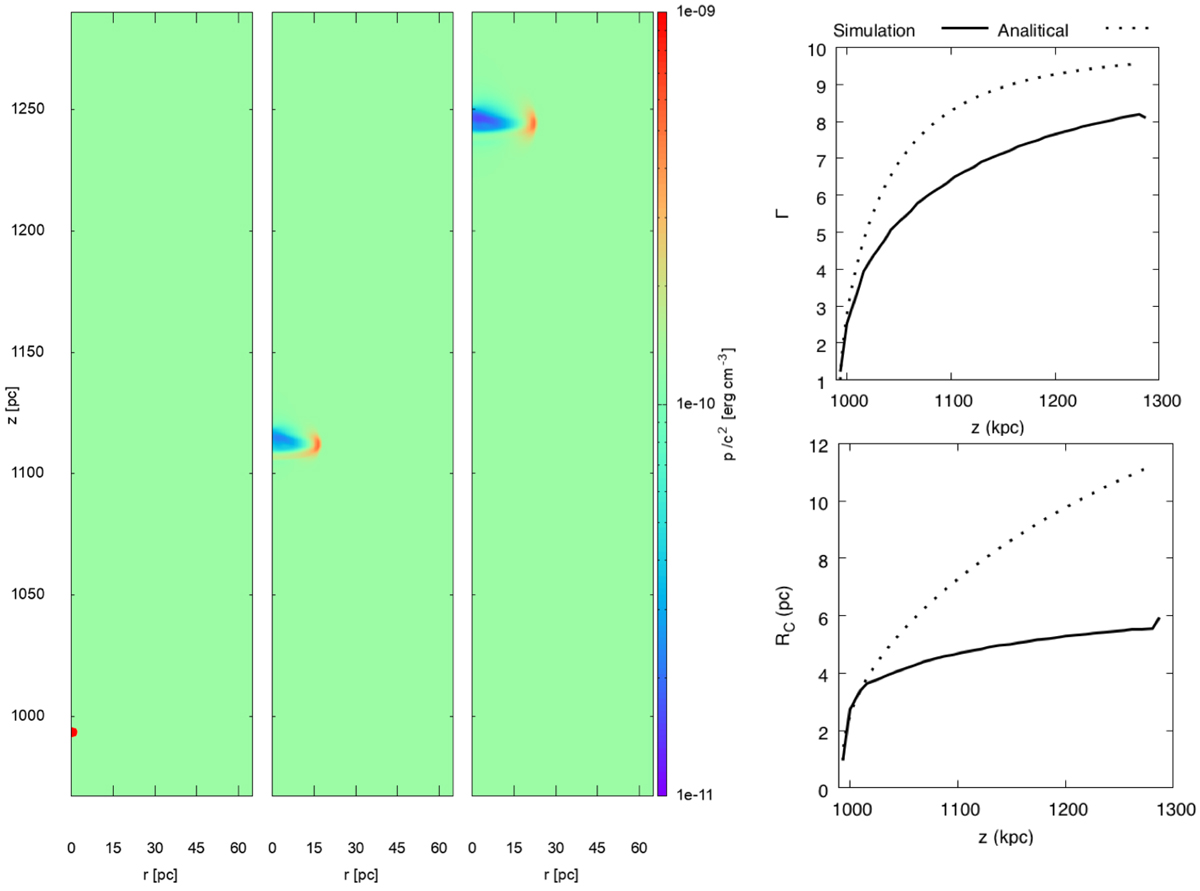
Left panel: density maps obtained from a hydrodynamic simulation of the interaction between the jet and the penetrating bubble. Three snapshots are taken ∼0.4, 400 and 950 yr after penetration to illustrate bubble evolution. Right panels: bubble Lorentz factor/bubble radius as a function of jet height as calculated through the analytical estimate (dotted line) of Barkov et al. (2010, 2012), used to derive all results presented in this work, and compared to those obtained through our simulations (solid line).
Current usage metrics show cumulative count of Article Views (full-text article views including HTML views, PDF and ePub downloads, according to the available data) and Abstracts Views on Vision4Press platform.
Data correspond to usage on the plateform after 2015. The current usage metrics is available 48-96 hours after online publication and is updated daily on week days.
Initial download of the metrics may take a while.