Fig. A.1.
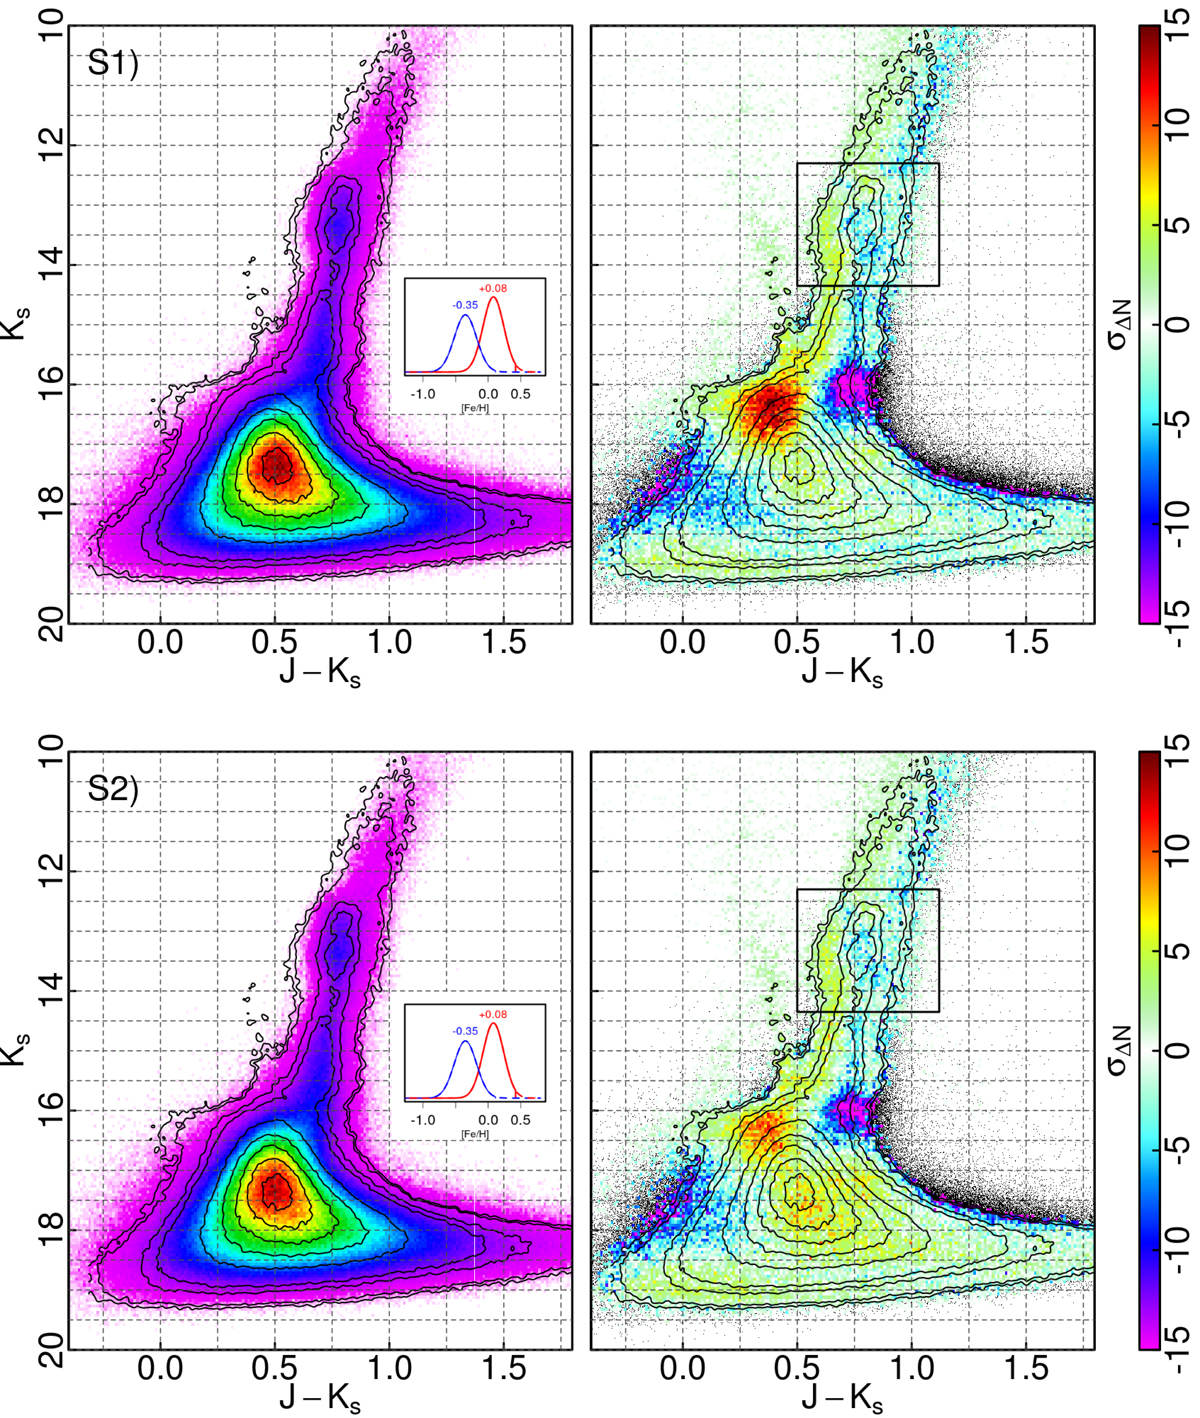
Left panels: synthetic CMDs corresponding to the six scenarios described in Sect. 6 compared to the isodensity curves of the observed clean sample as derived in Fig. 6 (solid black contours). The adopted MDF for all scenarios (except S4) is shown in the insets (see text). Right panels: residuals map providing the dispersion (e.g., the quality of the fit) between the synthetic and observed CMDs. The significant mismatch between the observations and simulations corresponds to |σΔN| ≳ 7. Regions of the CMD populated exclusively by simulated stars are indicated by black dots (see text). The boxes on the rightmost panels indicate the region of the CMD used to normalize the number of simulated stars to the observations.
Current usage metrics show cumulative count of Article Views (full-text article views including HTML views, PDF and ePub downloads, according to the available data) and Abstracts Views on Vision4Press platform.
Data correspond to usage on the plateform after 2015. The current usage metrics is available 48-96 hours after online publication and is updated daily on week days.
Initial download of the metrics may take a while.