Fig. 6.
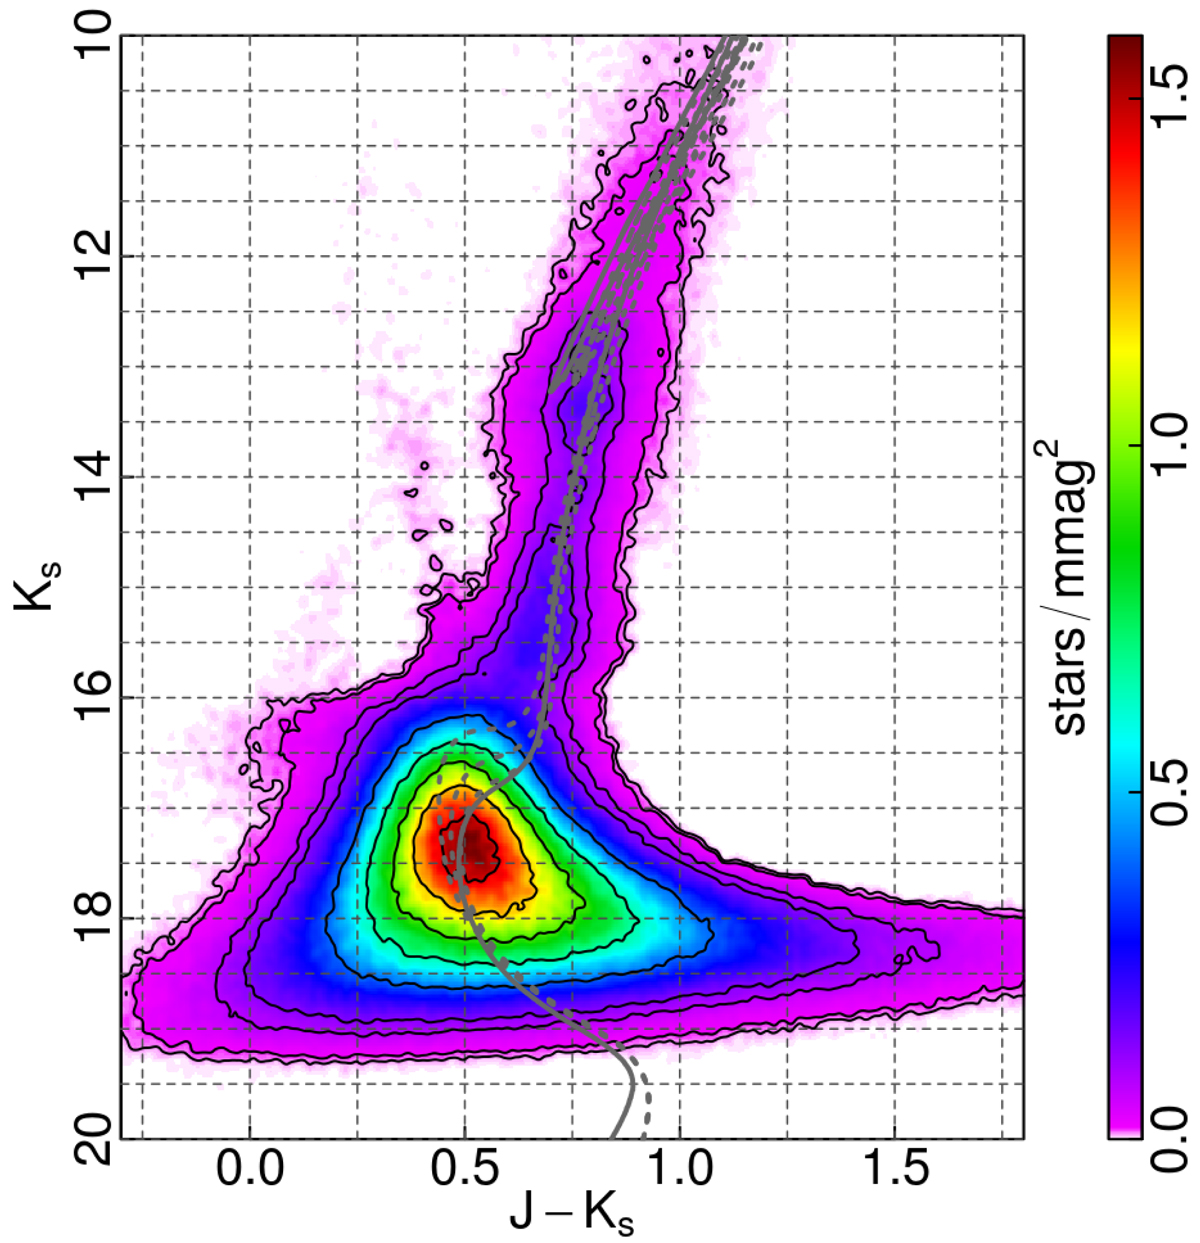
HESS diagram of the bulge b249 field statistically decontaminated from the foreground disk population. Solid black contours are isodensity curves spaced by 1% and 5%, and then from 1/12 to 11/12 of the maximum density in steps of 1/6. Also plotted are BaSTI isochrones for ages (bluest to reddest) 5, 7.5, 10, and 11 Gyr, following the metal-poor regime from GIBS for the oldest (gray lines), and metal-rich for all others (dotted line). The isochrones have been shifted so that their RC and RGB roughly match the observed ones.
Current usage metrics show cumulative count of Article Views (full-text article views including HTML views, PDF and ePub downloads, according to the available data) and Abstracts Views on Vision4Press platform.
Data correspond to usage on the plateform after 2015. The current usage metrics is available 48-96 hours after online publication and is updated daily on week days.
Initial download of the metrics may take a while.