Free Access
Fig. 4.
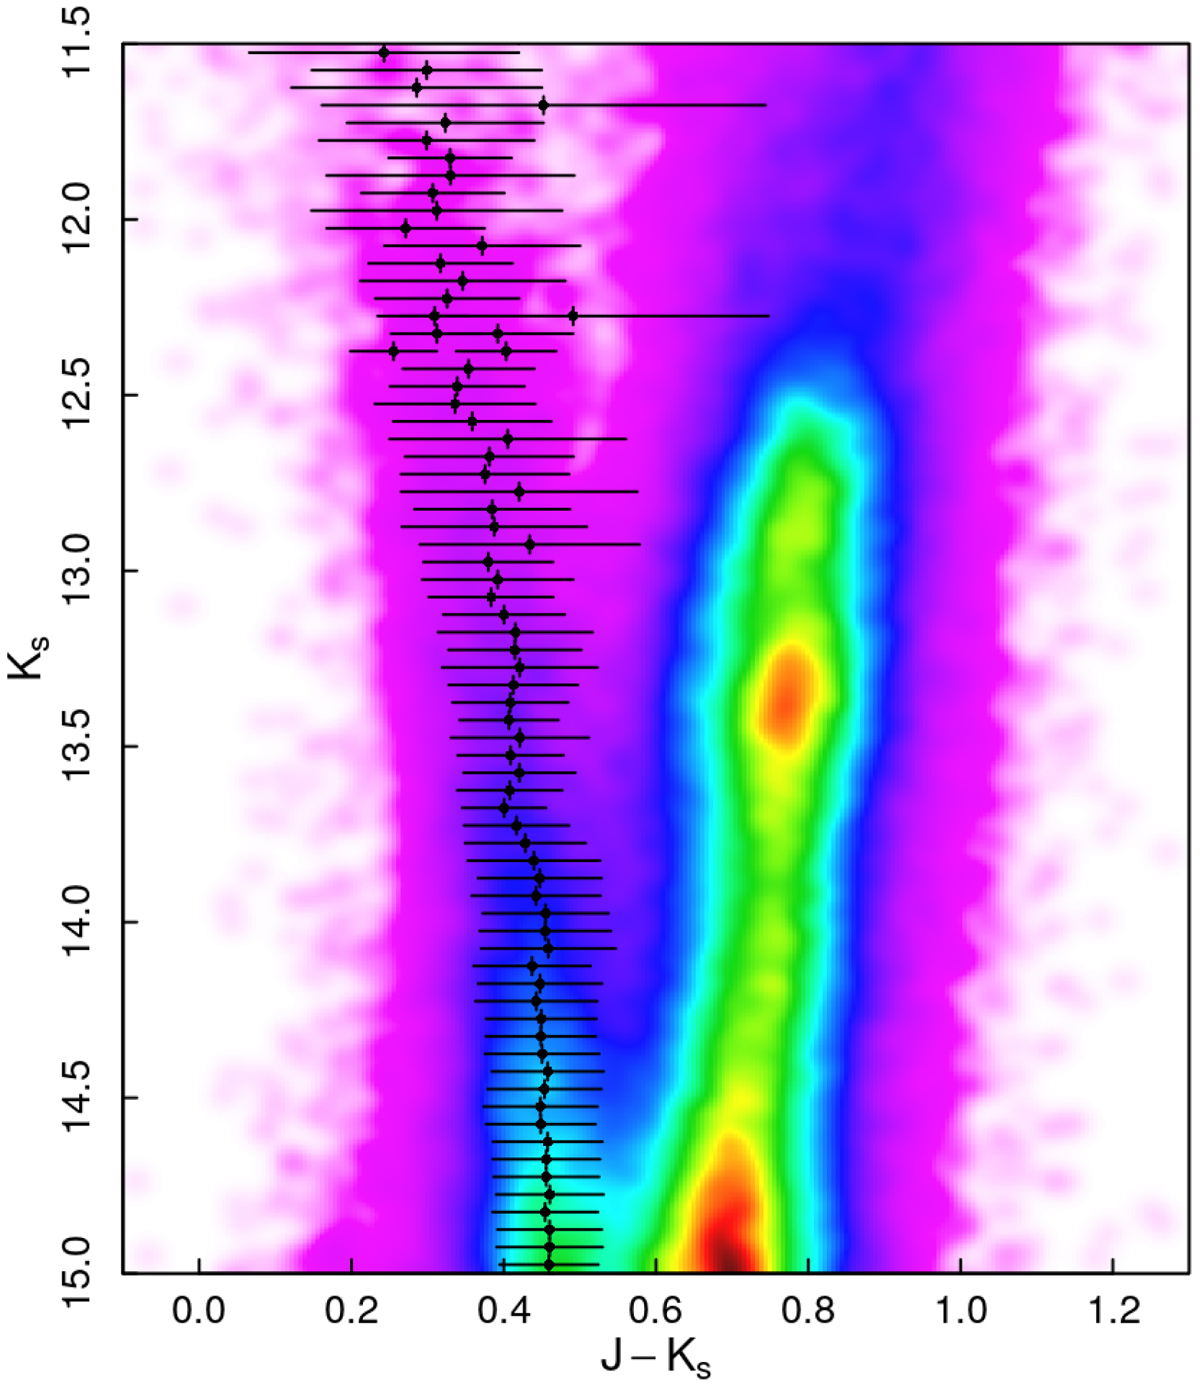
Color-coded Hess density diagram of b249 compared to the Gaussian young MS profile (black dots). Horizontal and vertical crosses refer respectively to the estimated sequence width and bin size.
Current usage metrics show cumulative count of Article Views (full-text article views including HTML views, PDF and ePub downloads, according to the available data) and Abstracts Views on Vision4Press platform.
Data correspond to usage on the plateform after 2015. The current usage metrics is available 48-96 hours after online publication and is updated daily on week days.
Initial download of the metrics may take a while.