Fig. 1.
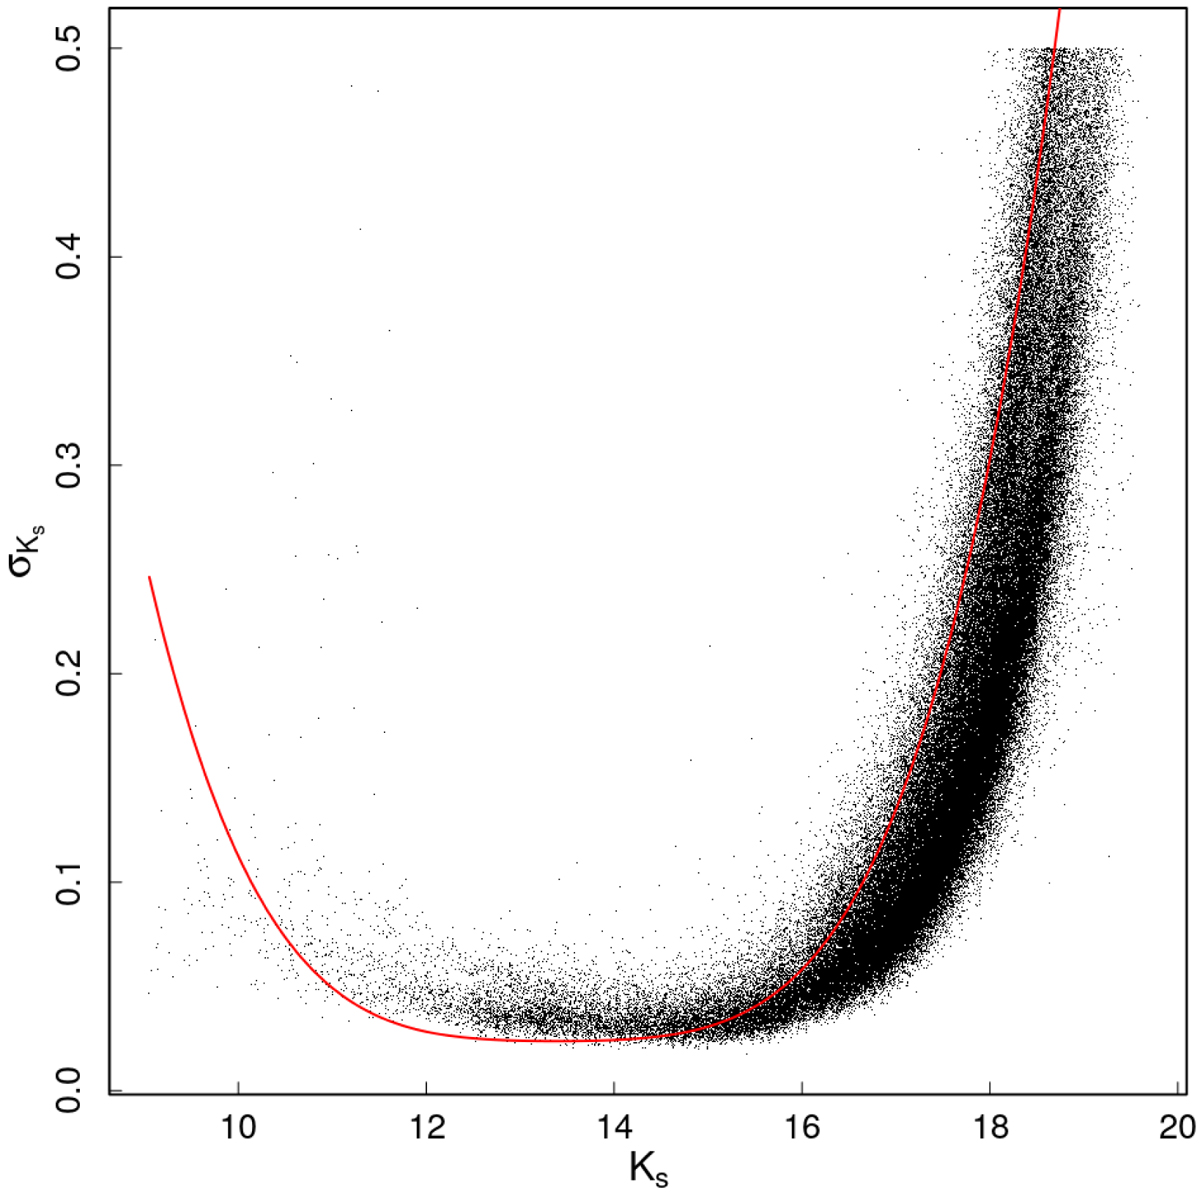
Distribution of photometric errors as a function of magnitude (black dots) in the Ks band of detector #12 for the bulge field b249. With the exception of the magnitude range 15 ≳ Ks ≳ 11, the photometric errors are well below the dispersion calculated from simulations (red line). Also worth noticing is the effect from saturation for stars with Ks ≲ 12.
Current usage metrics show cumulative count of Article Views (full-text article views including HTML views, PDF and ePub downloads, according to the available data) and Abstracts Views on Vision4Press platform.
Data correspond to usage on the plateform after 2015. The current usage metrics is available 48-96 hours after online publication and is updated daily on week days.
Initial download of the metrics may take a while.