Fig. 7
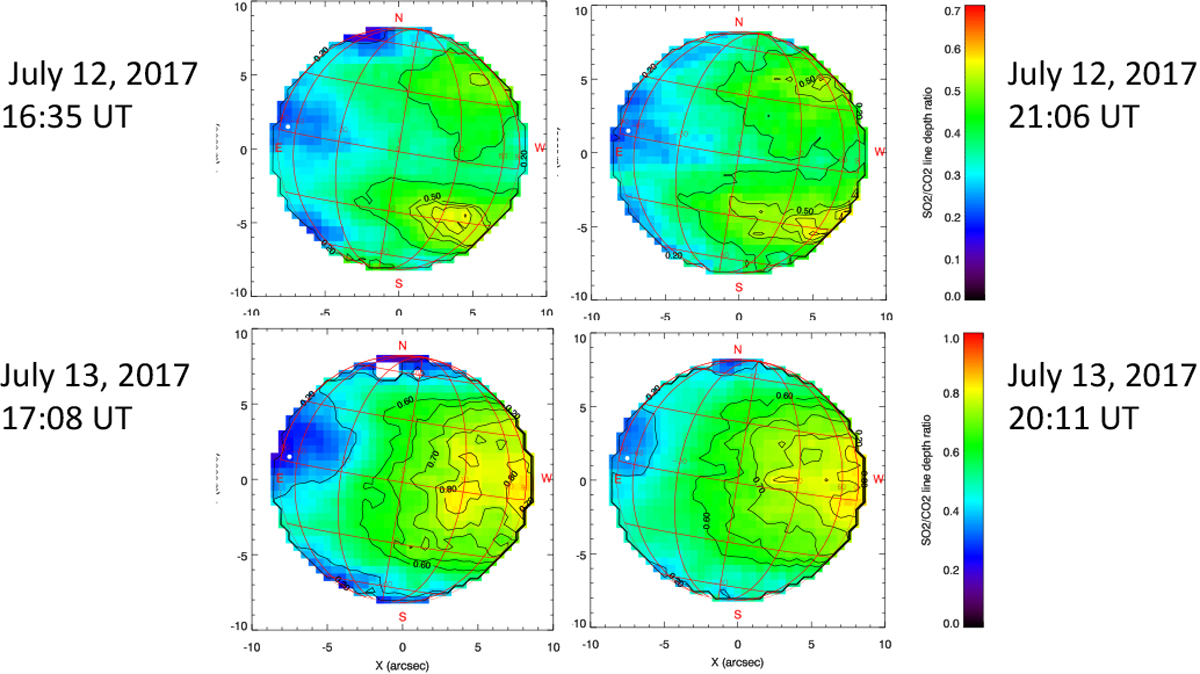
Maps of the line depth ratio of a weak SO2 multiplet around 1345.1 cm−1 to the CO2 transition at 1345.22 cm−1. Data correspond to the July 12 and 13, 2017. It can be seen for each day that the SO2 plumes follow the four-day rotation, corresponding to an angle of 15° westward for a time difference of 4 h. In both cases, the intermediate maps taken between the first and last ones reproduce the SO2 pattern shown in this figure. The subsolar point is shown as a white dot.
Current usage metrics show cumulative count of Article Views (full-text article views including HTML views, PDF and ePub downloads, according to the available data) and Abstracts Views on Vision4Press platform.
Data correspond to usage on the plateform after 2015. The current usage metrics is available 48-96 hours after online publication and is updated daily on week days.
Initial download of the metrics may take a while.