Open Access
Fig. 5
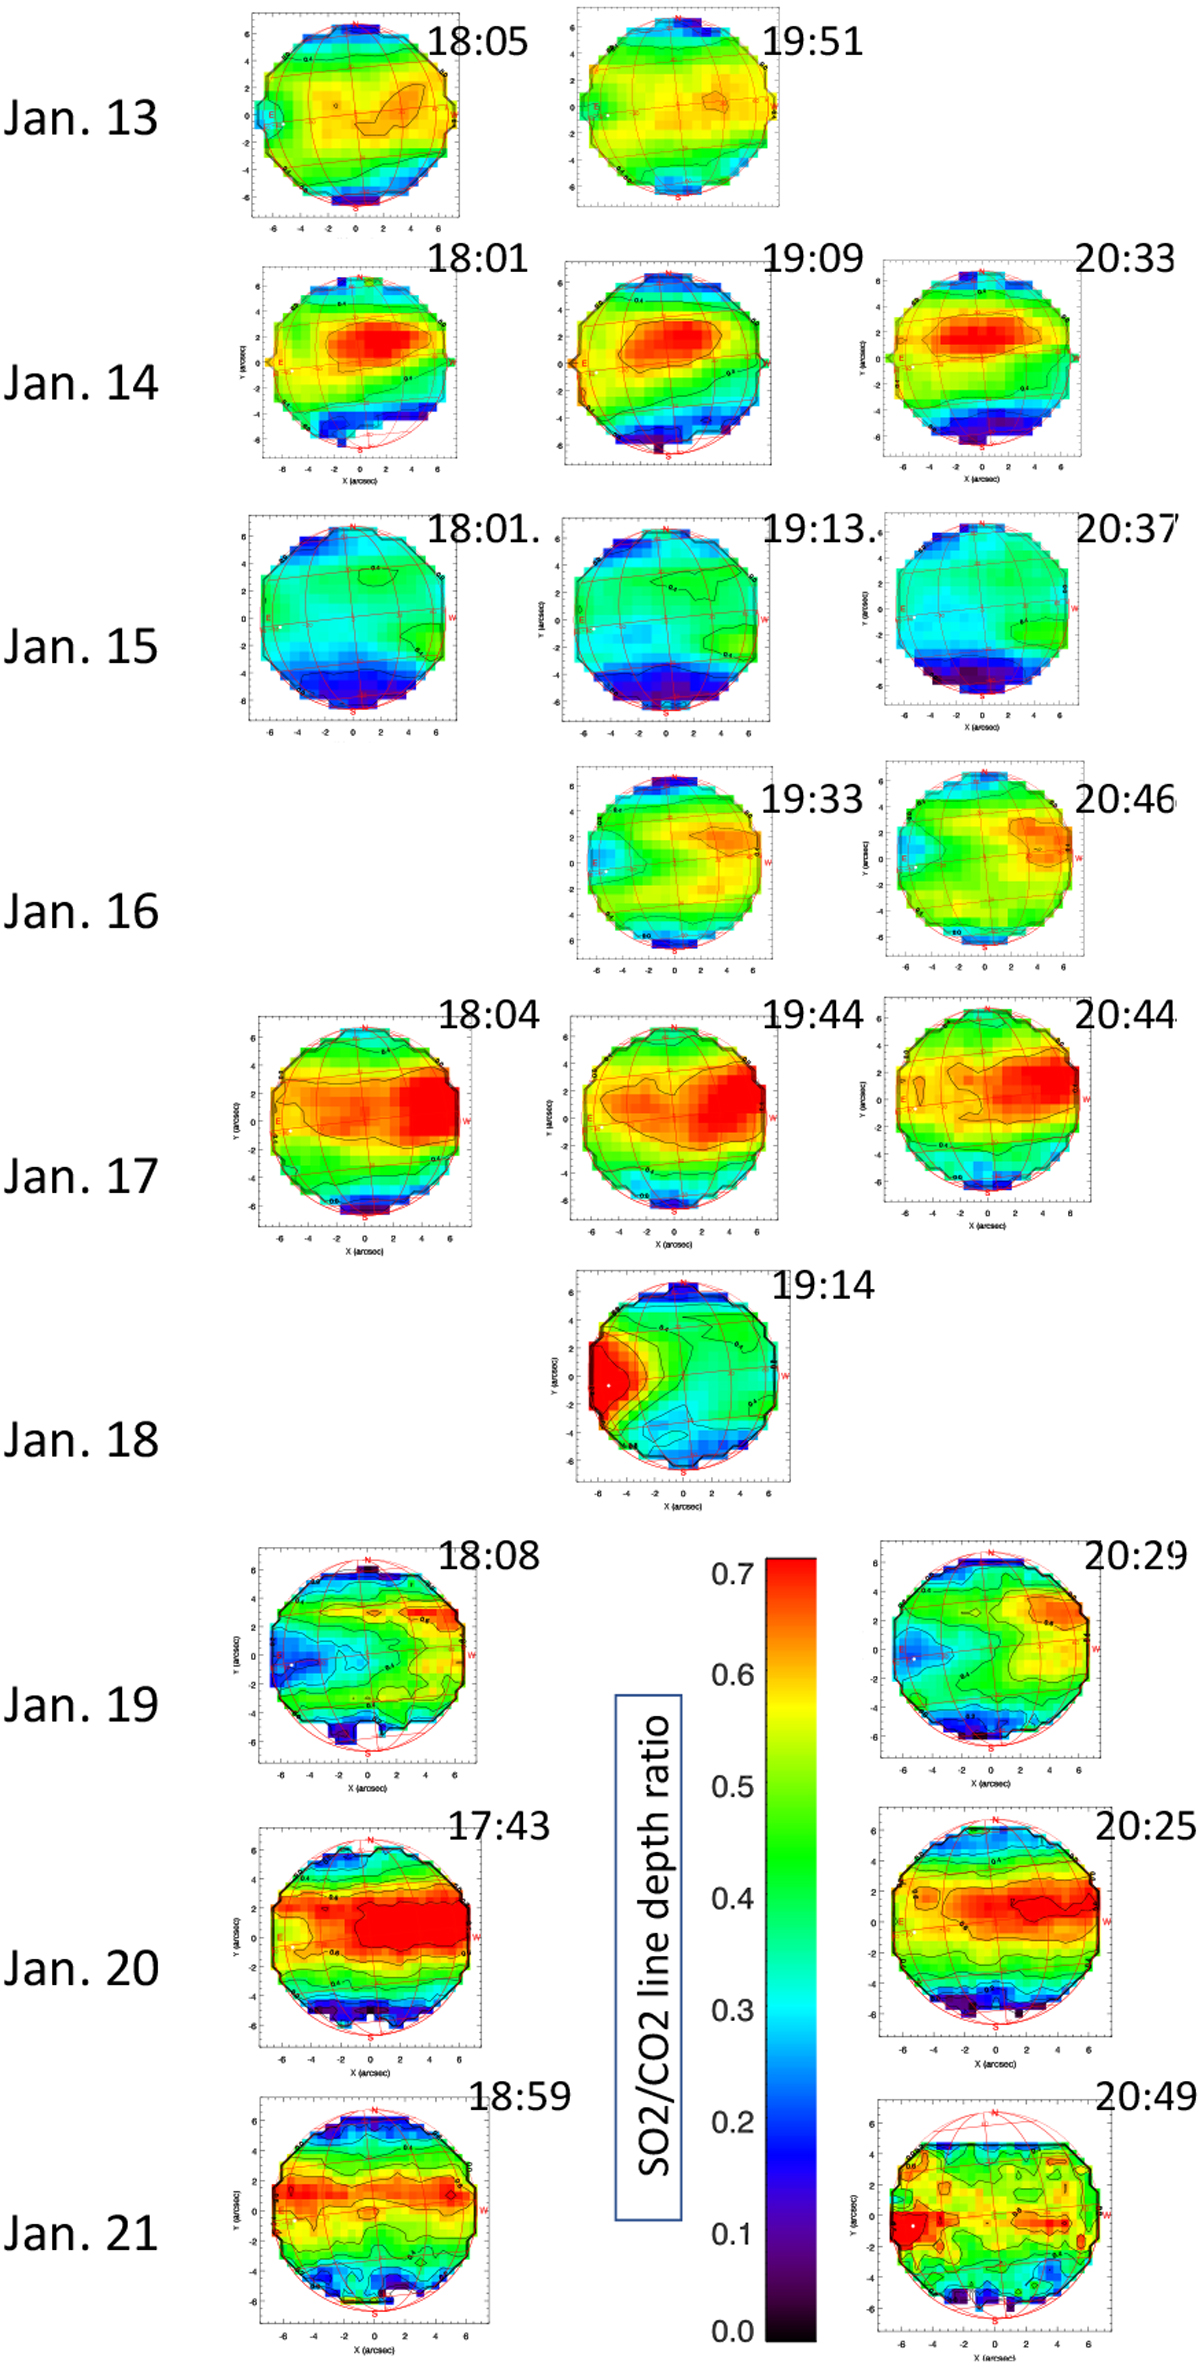
Maps of the SO2/CO2 line depth ratio, using SO2 multiplets (around 1345.1 and 1345.3 cm−1) divided by the CO2 transition at 1345.22 cm−1, between January 13, 2016, and January 21, 2016. The subsolar point is shown as a white dot.
Current usage metrics show cumulative count of Article Views (full-text article views including HTML views, PDF and ePub downloads, according to the available data) and Abstracts Views on Vision4Press platform.
Data correspond to usage on the plateform after 2015. The current usage metrics is available 48-96 hours after online publication and is updated daily on week days.
Initial download of the metrics may take a while.