Open Access
Fig. 19
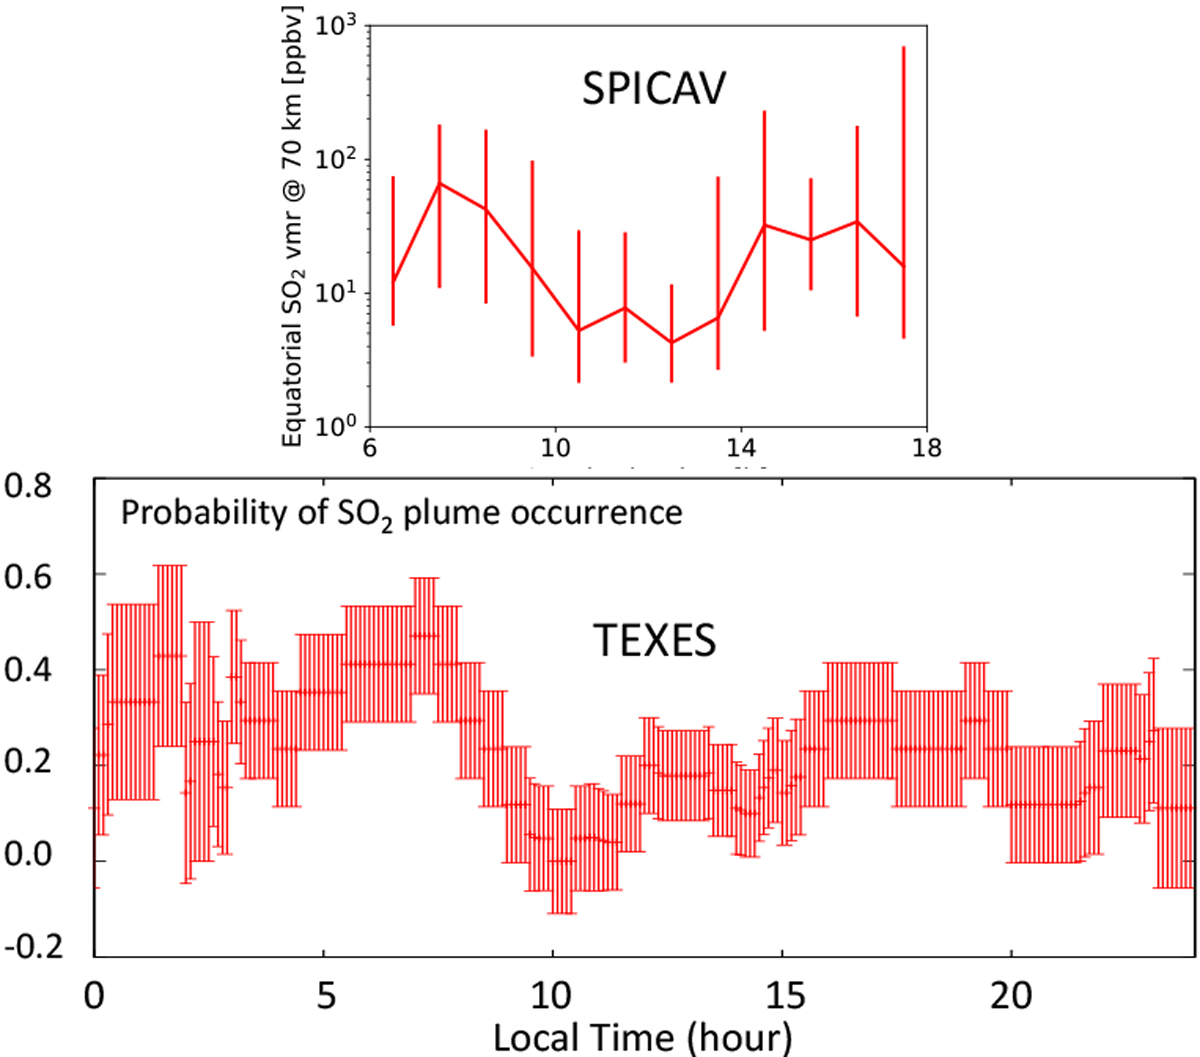
Top panel: SO2 volume mixing ratio, as observed by SPICAV aboard Venus Express at an altitude of 70 km as a function of local time, including all data between 2006 and 2015. Bottom panel: probability of occurrence of an SO2 plume as a function of local time, including TEXES data between 2012 and 2018 (see Fig. 11).
Current usage metrics show cumulative count of Article Views (full-text article views including HTML views, PDF and ePub downloads, according to the available data) and Abstracts Views on Vision4Press platform.
Data correspond to usage on the plateform after 2015. The current usage metrics is available 48-96 hours after online publication and is updated daily on week days.
Initial download of the metrics may take a while.