Fig. 16
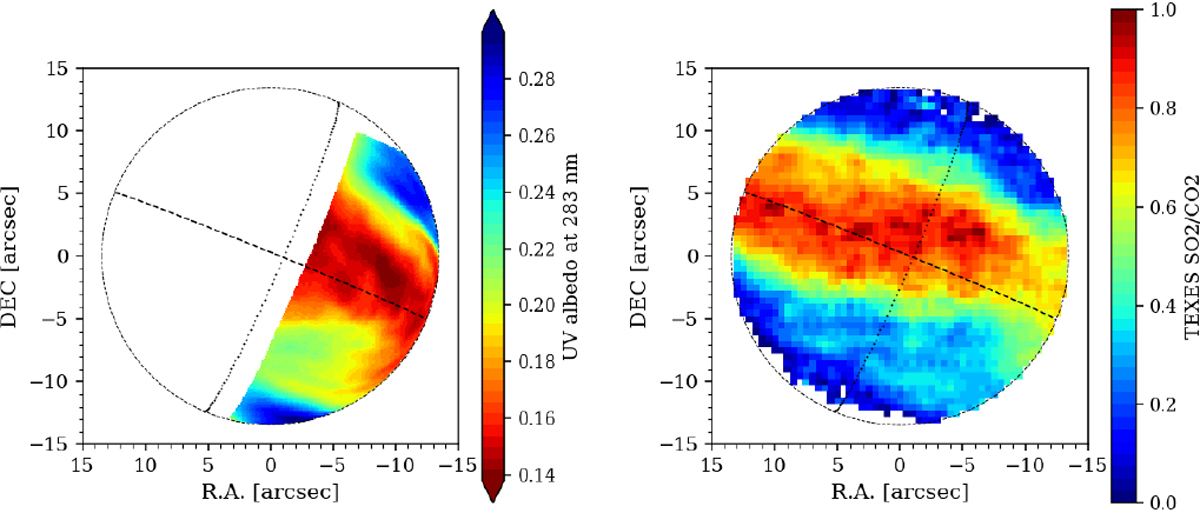
Left panel: UV albedo map derived from the Akatsuki UVI data recorded on January 21, 2017, at 01:46 UT. Dashed lines represent the equator and the evening terminator. Right panel: TEXES map of the SO2 volume mixing ratio at the cloudtop, inferred from the SO2/CO2 line depth ratio at 7.4 μm on January 21, 2017, at 03:43–04:18 UT.
Current usage metrics show cumulative count of Article Views (full-text article views including HTML views, PDF and ePub downloads, according to the available data) and Abstracts Views on Vision4Press platform.
Data correspond to usage on the plateform after 2015. The current usage metrics is available 48-96 hours after online publication and is updated daily on week days.
Initial download of the metrics may take a while.