Free Access
Fig. 8.
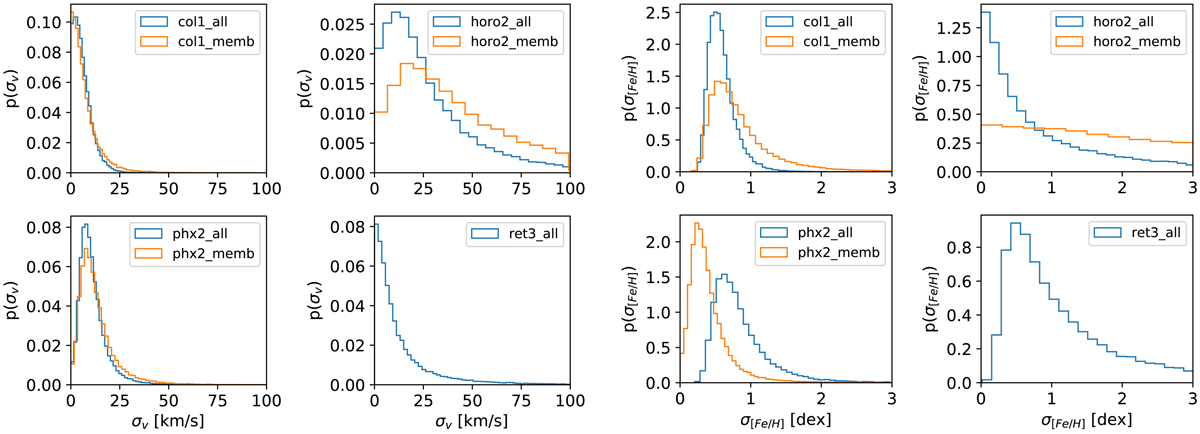
Posterior probability distribution function of the dispersion in l.o.s. velocity (left panel) and metallicity (right panel) for the four satellites. The blue line shows the results when all potential members are considers and the orange line represents the most probable members.
Current usage metrics show cumulative count of Article Views (full-text article views including HTML views, PDF and ePub downloads, according to the available data) and Abstracts Views on Vision4Press platform.
Data correspond to usage on the plateform after 2015. The current usage metrics is available 48-96 hours after online publication and is updated daily on week days.
Initial download of the metrics may take a while.