Fig. 10.
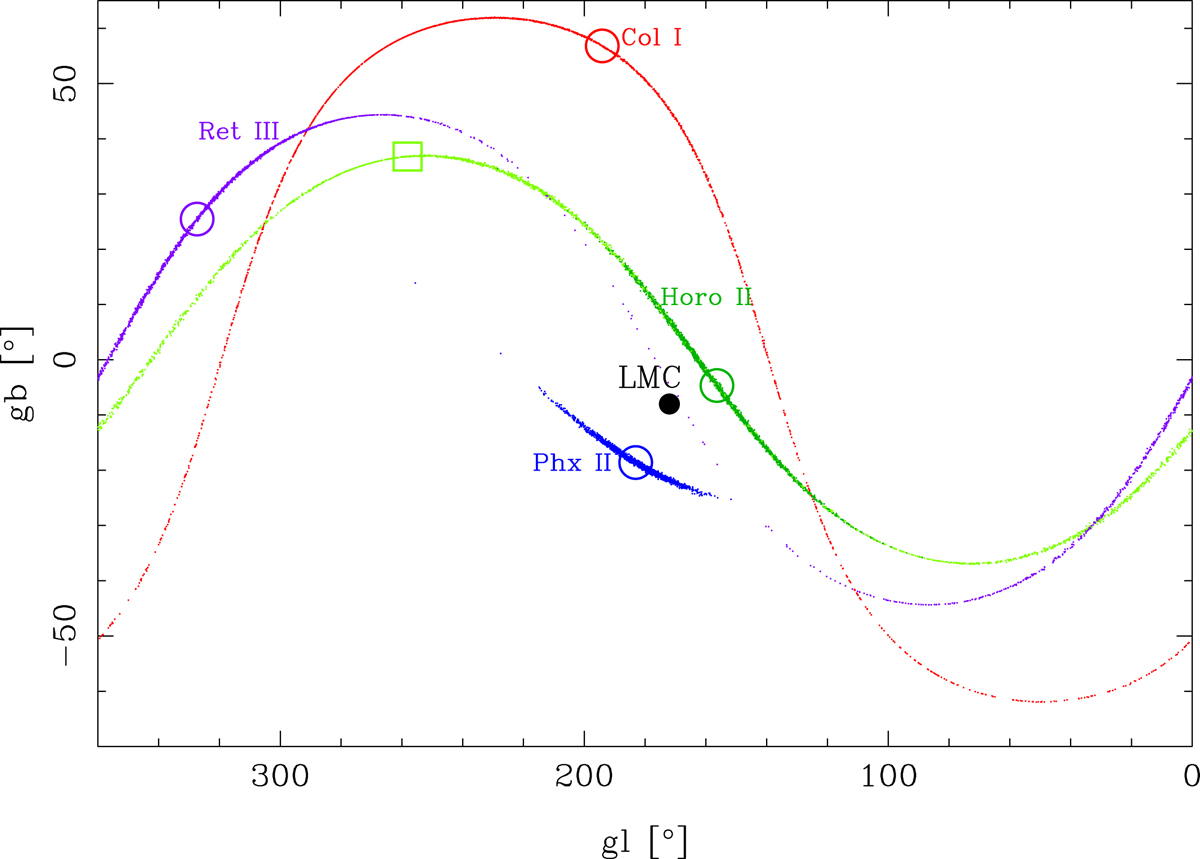
All-sky view of orbital poles for the objects in the sample; the open circles (or square) indicate the value that follows from the measurements, and the small points around each object plot the orbital poles from the individual Monte Carlo simulations. We show our preferred membership selection for all satellites; for Horo II, we also show the other option in light green, which covers nearly the full great circle. The two options lead to very similar results for the other satellites.
Current usage metrics show cumulative count of Article Views (full-text article views including HTML views, PDF and ePub downloads, according to the available data) and Abstracts Views on Vision4Press platform.
Data correspond to usage on the plateform after 2015. The current usage metrics is available 48-96 hours after online publication and is updated daily on week days.
Initial download of the metrics may take a while.