Fig. 9
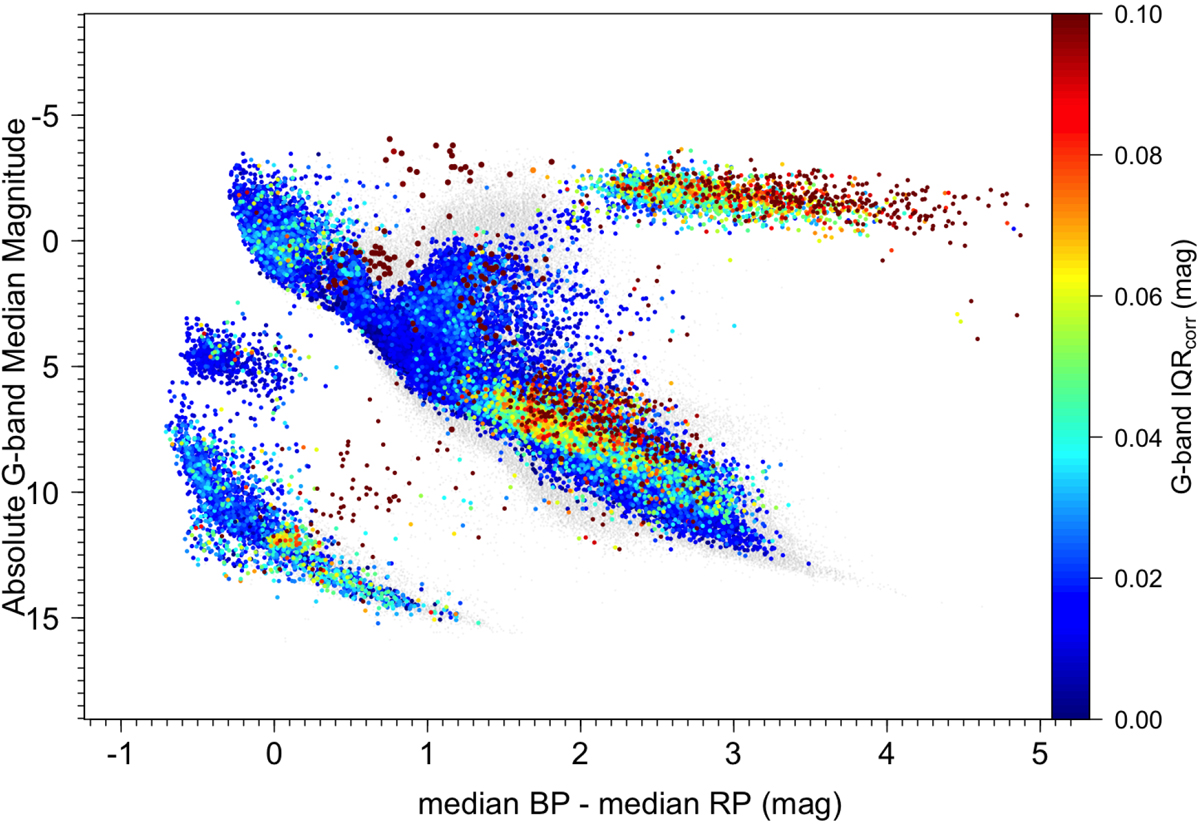
Amplitude of variability in the CaMD based on a selection of classified variables within 1 kpc and with a relative uncertainty for the parallax of 5%. The colour scale shows the corrected G-band IQR (see text) with a cut-off at 0.1 mag to emphasise the low- and mid-level variability. The background points in grey represent classified constant stars. All objects satisfy the selection criteria described in Appendix B, in addition to the stricter conditions on parallax and its precision, as mentioned above. The effects of interstellar extinction are not corrected for.
Current usage metrics show cumulative count of Article Views (full-text article views including HTML views, PDF and ePub downloads, according to the available data) and Abstracts Views on Vision4Press platform.
Data correspond to usage on the plateform after 2015. The current usage metrics is available 48-96 hours after online publication and is updated daily on week days.
Initial download of the metrics may take a while.