Fig. 8.
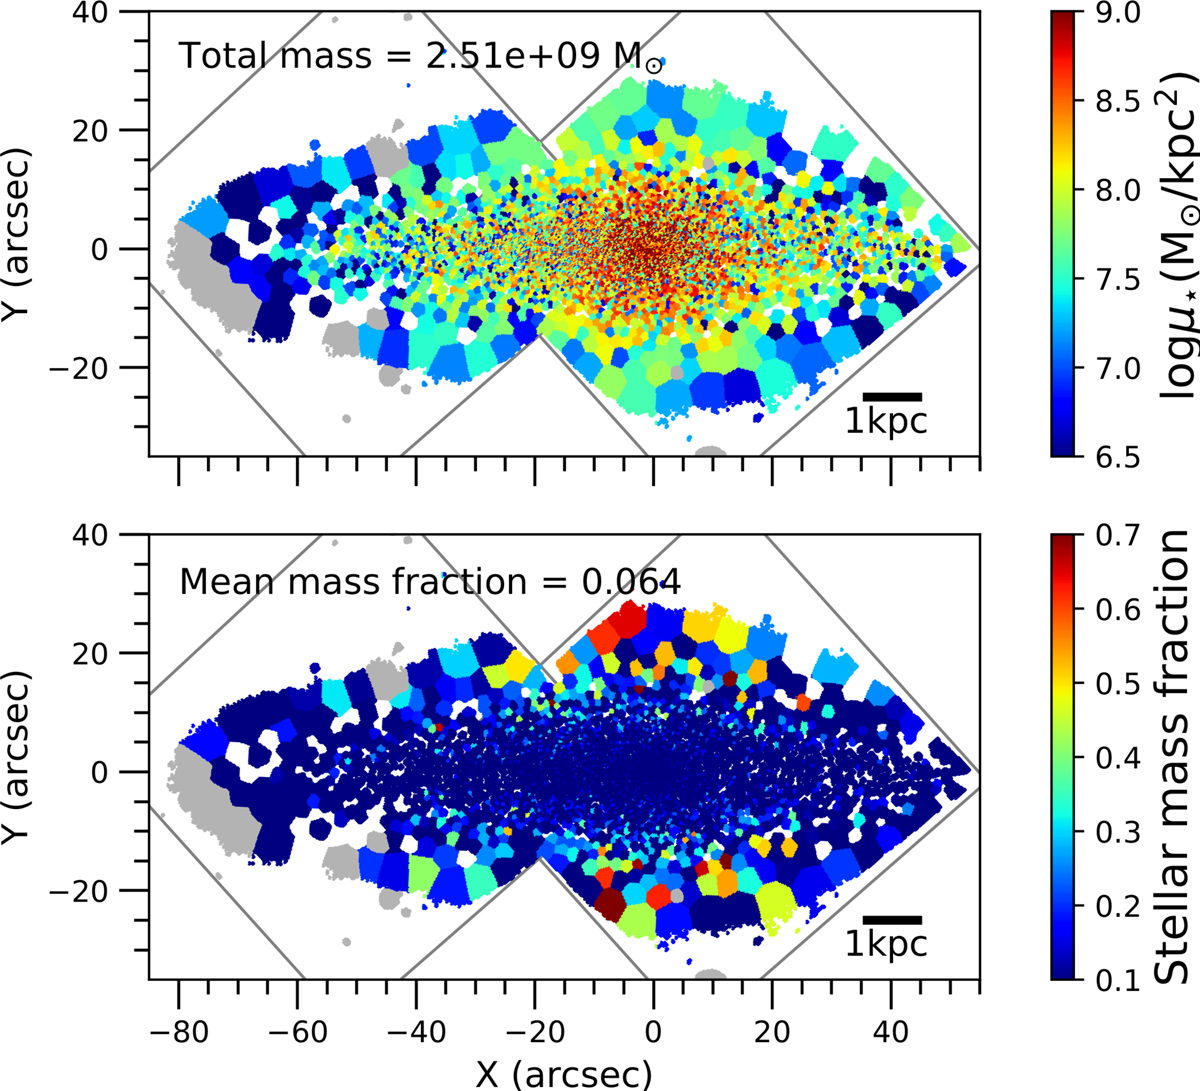
Distribution of the stellar population with ages between 9 and 11 Gyr, metallicity between −0.96 and −0.06 dex and [Mg/Fe] ∼ 0.4 dex. The color scale shows the stellar mass density in the top panel and the stellar mass fraction in the bottom panel. The total mass or the mean mass fraction in this specific population are indicated on bottom-left of respectively the top and the bottom maps. In each panel, the position of the two MUSE pointings is plotted in gray and a scale bar on bottom-right indicates the correspondence with physical units.
Current usage metrics show cumulative count of Article Views (full-text article views including HTML views, PDF and ePub downloads, according to the available data) and Abstracts Views on Vision4Press platform.
Data correspond to usage on the plateform after 2015. The current usage metrics is available 48-96 hours after online publication and is updated daily on week days.
Initial download of the metrics may take a while.