Fig. 7.
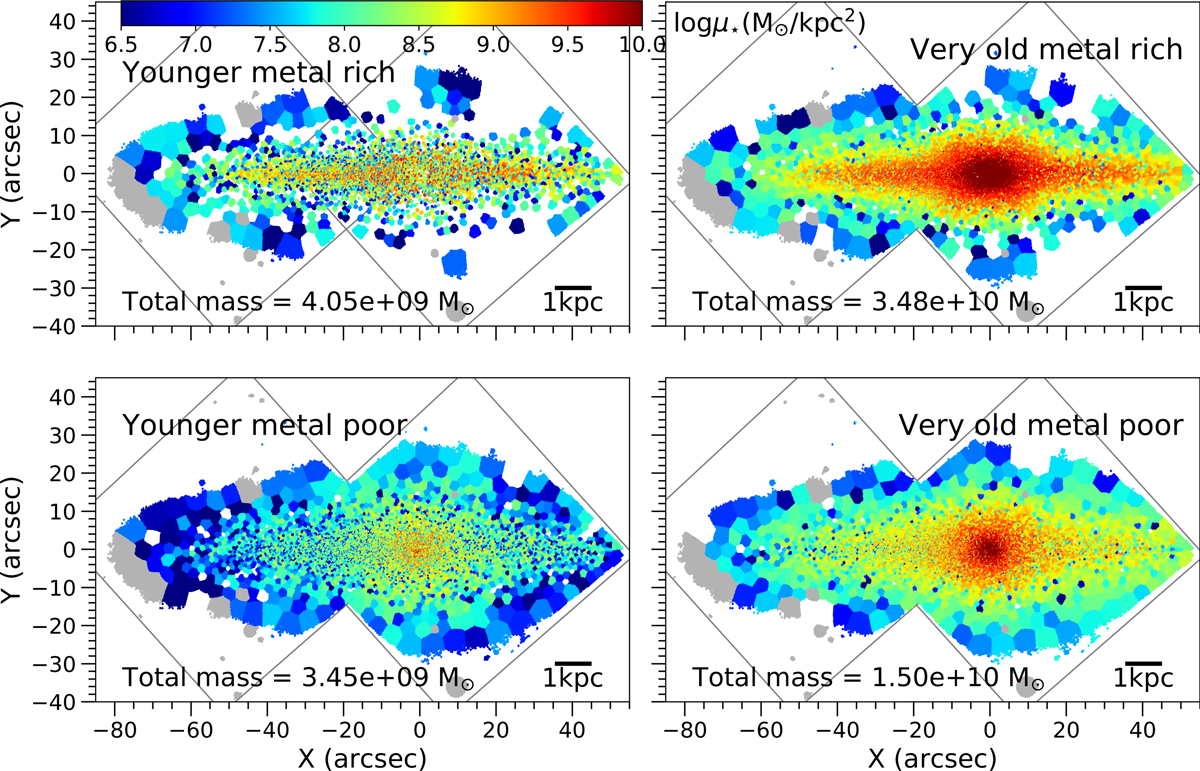
Maps of some combinations of age and metallicity for the stellar populations in FCC 170. Top panels: most metal-rich populations ([M/H] ≥ 0.06 dex). Bottom panels: most metal-poor populations ([M/H] ≤ −0.25). Left panels: little younger populations (ages ≤ 11.5 Gyr). Right panels: oldest populations (ages ≥ 11.5 Gyr). The color scale shows the mass density corresponding to the populations in the specific age-metallicity bin. The total mass in the age-metallicity bin is indicated on bottom-left of each map. The position of the two MUSE pointings is plotted in gray. A scale bar on bottom-right of each map indicates the correspondence with physical units.
Current usage metrics show cumulative count of Article Views (full-text article views including HTML views, PDF and ePub downloads, according to the available data) and Abstracts Views on Vision4Press platform.
Data correspond to usage on the plateform after 2015. The current usage metrics is available 48-96 hours after online publication and is updated daily on week days.
Initial download of the metrics may take a while.